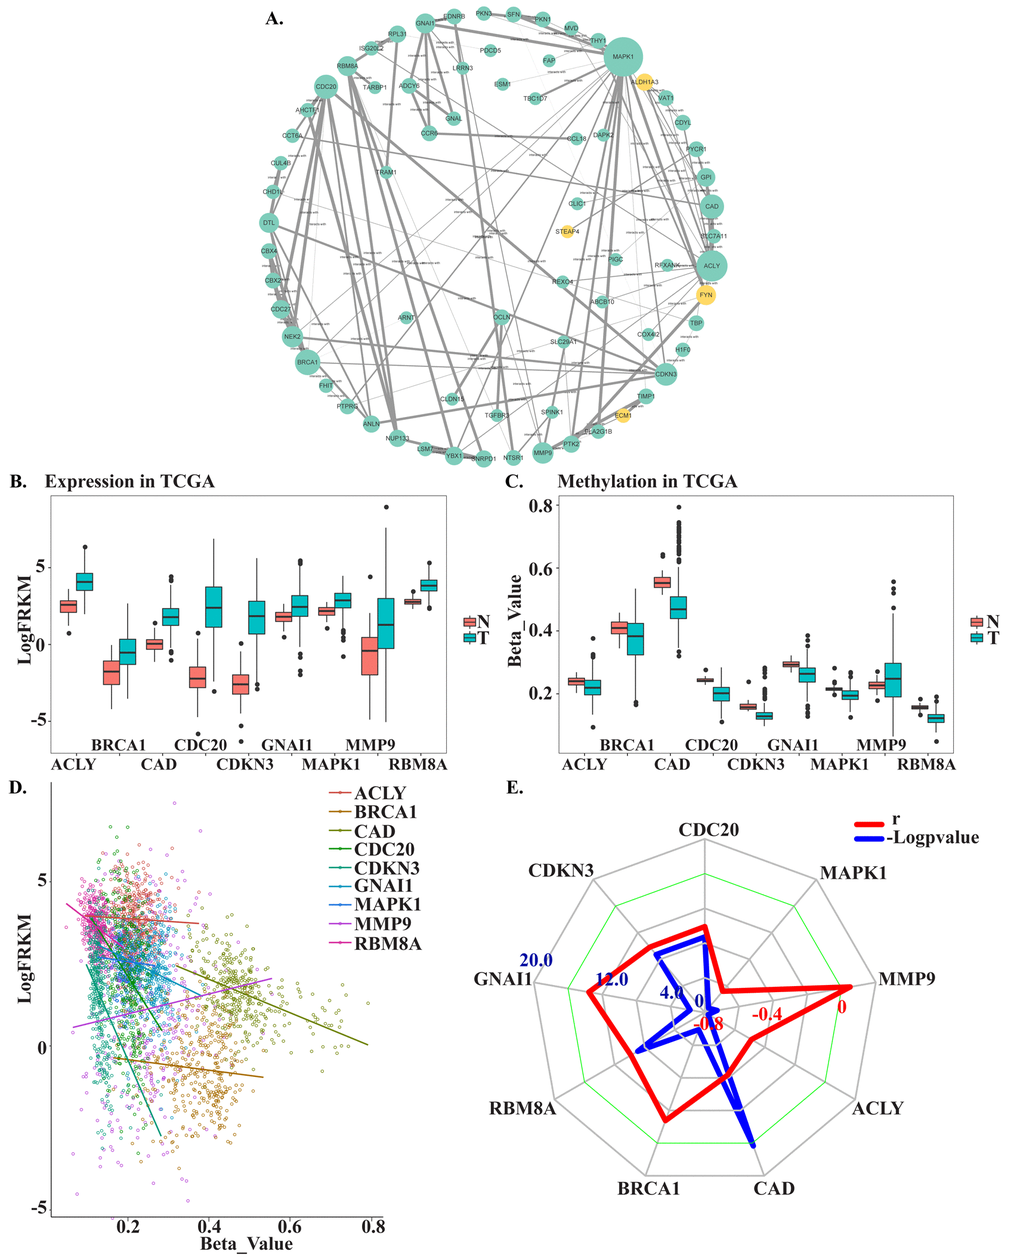
Figure 3.Screening and verifying hub MDEGs. (A) Protein-protein interaction network of MDEGs. Green dot represents hypo methylation-high expression gene. Yellow dot represents hyper methylation- low expression. The size of dot was decided by the connection degree of gene and the width of line between genes was decided by connectivity between two genes. (B) Expression of hub genes in TCGA. (C) Methylation of hub genes in TCGA. Beta-Value represents ratio of methylation. T represents tumor tissue, N represents normal tissue. (D) Correlation of expression and methylation of hub genes. (E) Radar map of hub genes correlation. Red line represents r and blue line represents -Logpvalue.