Submit an Article
Navigate
Home
Editorial Board
Editorial Policies
Current Volume
Archive
Scientific Integrity
Publication Ethics Statements
Interviews with Outstanding Authors
Newsroom
Sponsored Conferences
Podcast
Contact
Special Collections
Submit an Article
Online ISSN: 1945-4589
Research Paper
|
Volume 10, Issue 12
|
pp. 4054–4065
Association of gut microbiota composition and function with a senescence-accelerated mouse model of Alzheimer’s Disease using 16S rRNA gene and metagenomic sequencing analysis
Back to article
Figure 6
(6 of 8)
−
100%
+
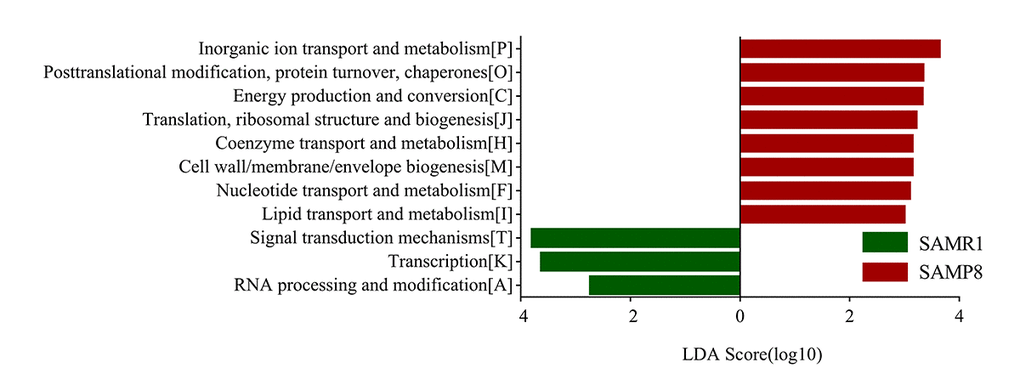
Figure 6.
COG category differences in metagenome between the SAMP8 and SAMR1 analyzed by LEfSe analysis (LDA> 2.5, P< 0.05).
Histogram of the LDA scores for differentially abundant COG categories.