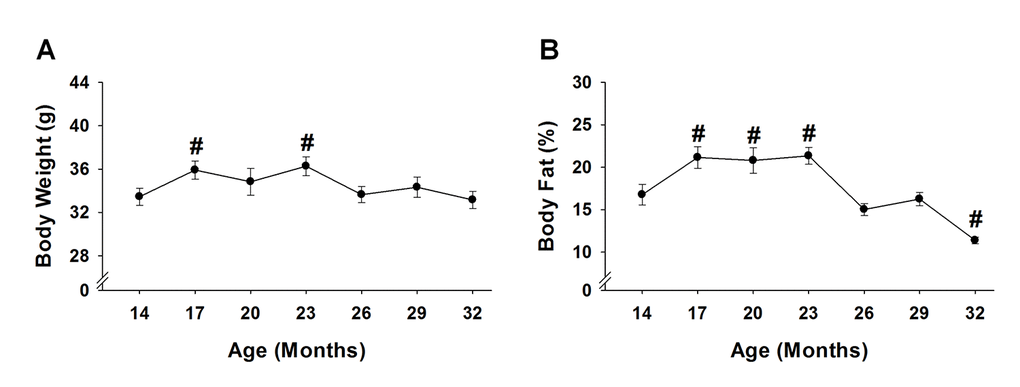
Figure 5.Body weight and body fat % across the lifespan. Body weight (A) and body fat % (B) of 15 mice were analyzed to test age-related changes using one-way repeated measures ANOVA followed by Bonferroni post-hoc. #, p<0.05 compared to 14 months of age.