Aging
Navigate
Back to articleFigure 7(7 of 8)
100%
Figure 7
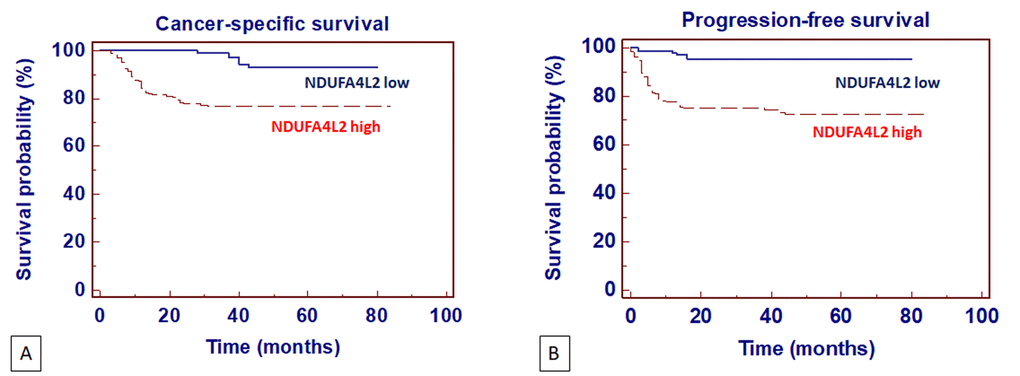
Figure 7.Kaplan-Meier cancer-specific survival (CSS) (A) and progression-free survival (PFS) (B) curves, stratified by NDUFA4L2 tissue expression levels. Patients with higher NDUFA4L2 levels had reduced CSS and PFS as compared to patients with lower values.
Figure 7 — Integrated multi-omics characterization reveals a distinctive metabolic signature and the role of NDUFA4L2 in promoting angiogenesis, chemoresistance, and mitochondrial dysfunction in clear cell renal cell carcinoma | Aging