Submit an Article
Navigate
Home
Editorial Board
Editorial Policies
Current Volume
Archive
Scientific Integrity
Publication Ethics Statements
Interviews with Outstanding Authors
Newsroom
Sponsored Conferences
Podcast
Contact
Special Collections
Submit an Article
Online ISSN: 1945-4589
Research Paper
|
Volume 10, Issue 12
|
pp. 3957–3985
Integrated multi-omics characterization reveals a distinctive metabolic signature and the role of NDUFA4L2 in promoting angiogenesis, chemoresistance, and mitochondrial dysfunction in clear cell renal cell carcinoma
Back to article
Figure 2
(2 of 8)
−
100%
+
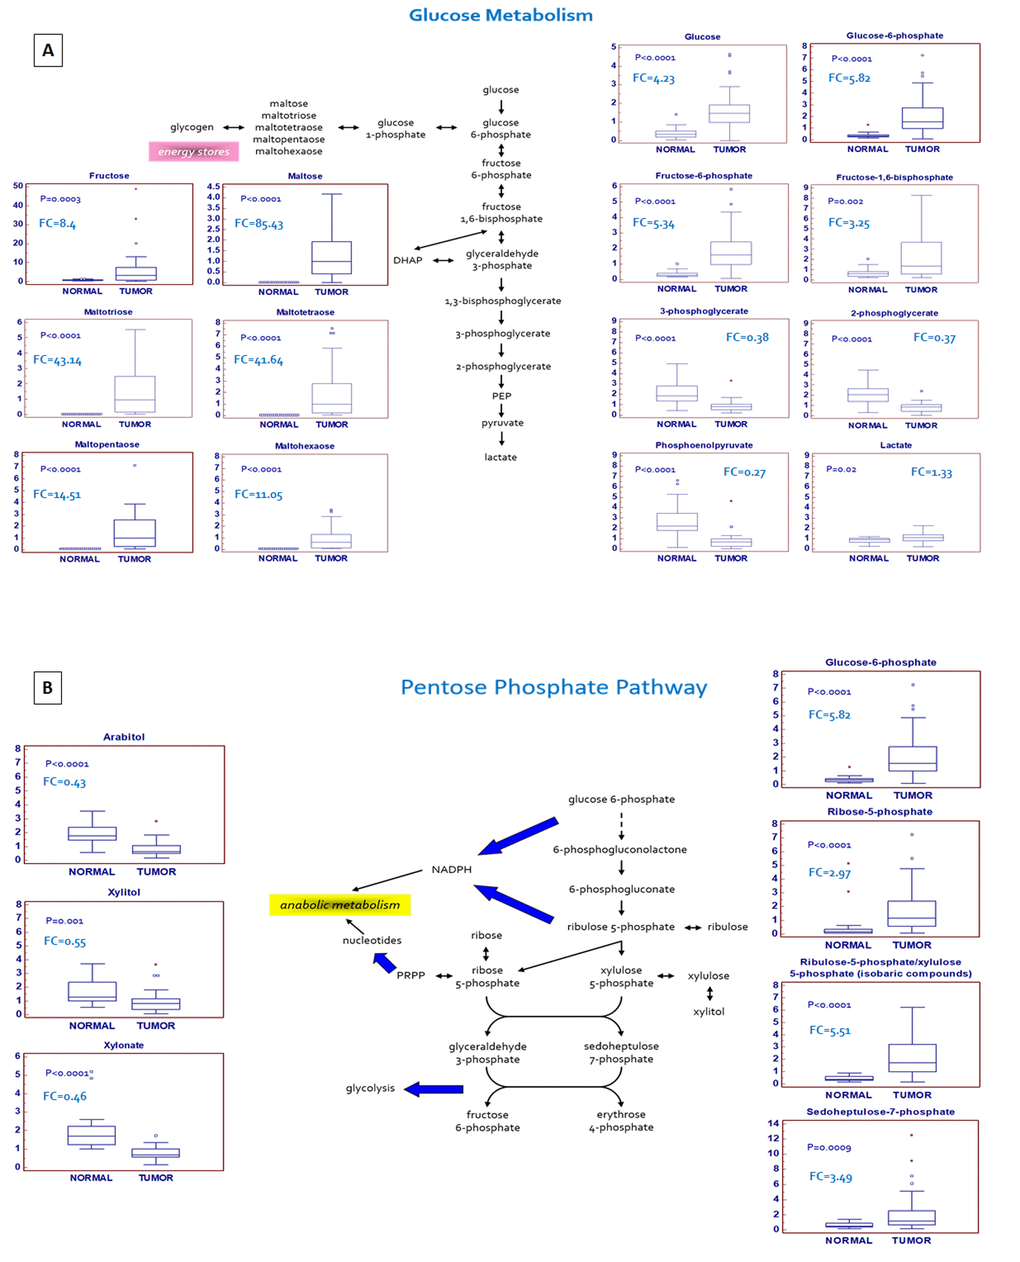
Figure 2.
Schematic model summarizing the differences in glucose metabolism (
A
) and pentose phosphate pathway (
B
) between normal and tumor tissue.