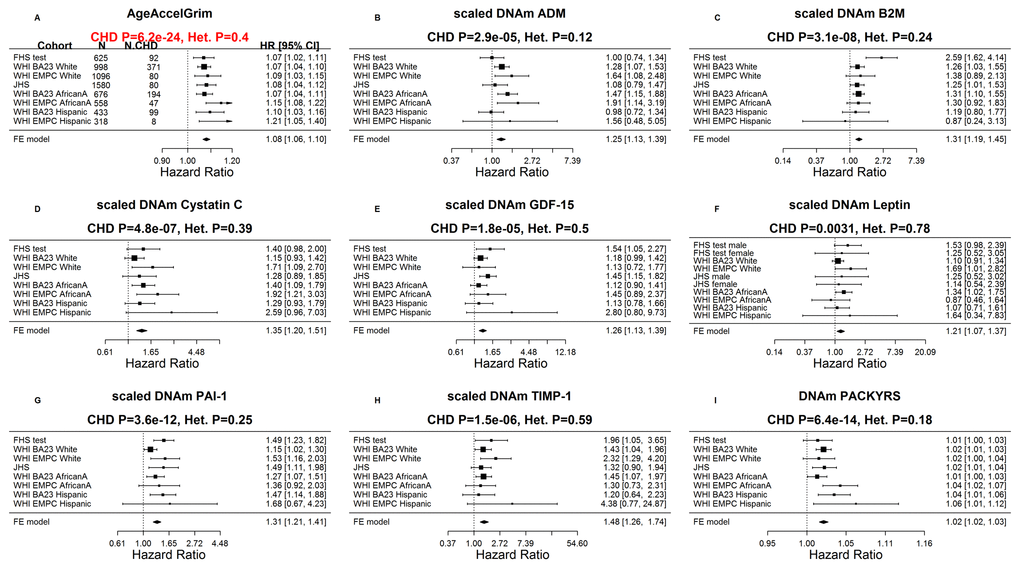
Figure 4.Meta analysis forest plots for predicting time-to-coronary heart disease. Each panel reports a meta-analysis forest plot for combining hazard ratios predicting time to CHD and the DNAm-based biomarker (reported in the figure heading) across different strata formed by racial groups within cohorts. (A) Results for AgeAccelGrim. Each row reports a hazard ratio (for time-to-CHD) and a 95% confidence interval resulting from a Cox regression model in each of 9 strata (defined by cohort and racial groups). Results for (age adjusted) DNAm-based surrogate markers of (B) adrenomedullin (ADM), (C) beta-2 microglobulin (B2M), (D) cystatin C (Cystatin C), (E) growth differentiation factor 15 (GDF-15), (F) leptin, (G) plasminogen activation inhibitor 1 (PAI-1), (H) tissue inhibitor metalloproteinase 1 (TIMP-1) and (I) smoking pack-years (PACKYRS). The sub-title of each panel reports the meta-analysis p-value and a p-value for a test of heterogeneity Cochran Q test (Het.). (A) Each hazard ratio (HR) corresponds to a one-year increase in AgeAccelGrim. (B-H) Each hazard ratio corresponds to an increase in one-standard deviation. (I) Hazard ratios correspond to a one unit increased in DNAm pack-years. The most significant meta-analysis P value (here AgeAccelGrim) is marked in red.