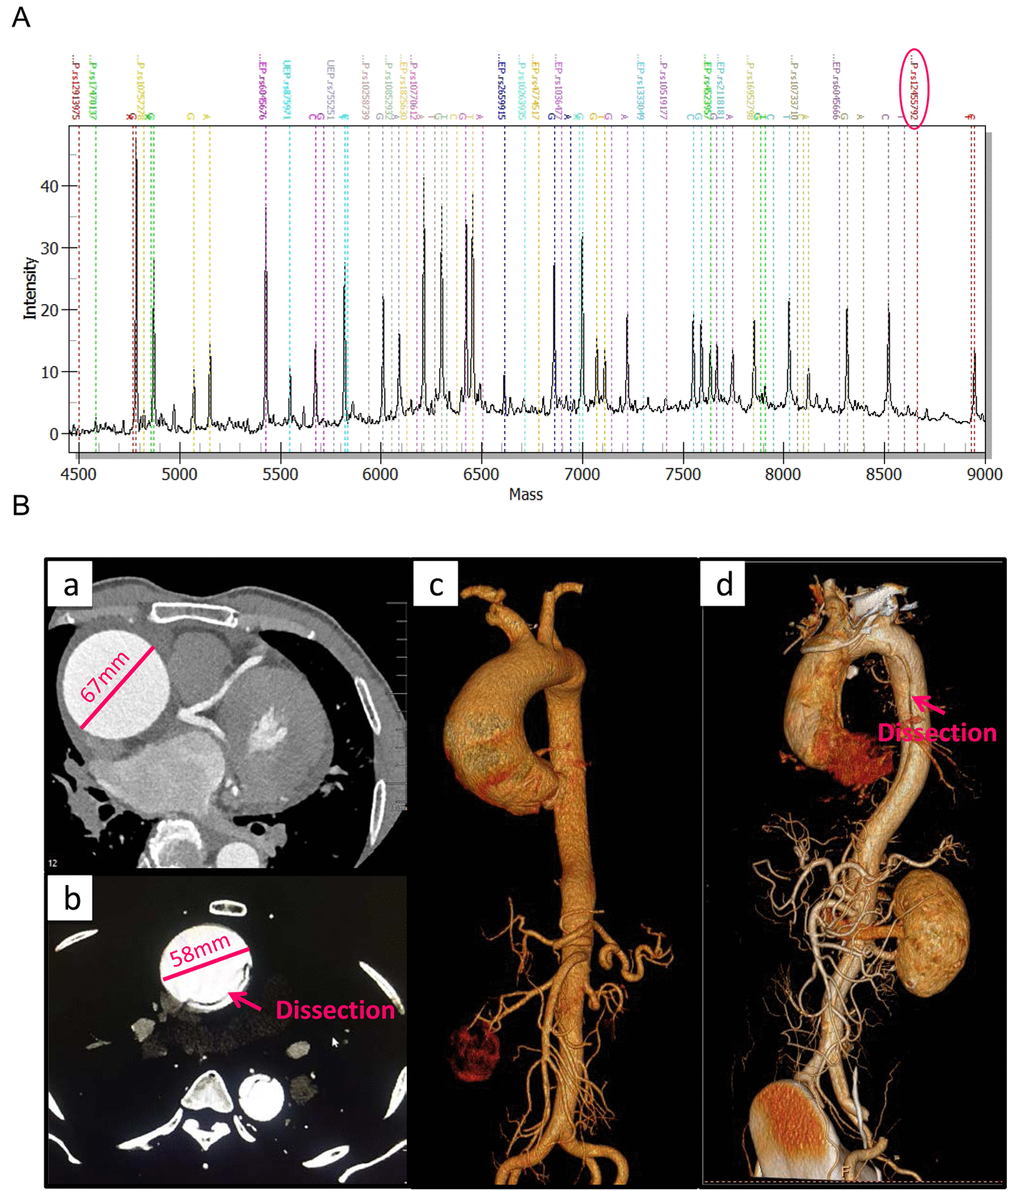
Figure 1.The MALDI-TOF MS spectrum of candidate SNPs and large vessels CT angiography for clinical features of TAAD patients. (A) The MALDI-TOF MS spectrum of candidate SNPs. Genotypes of SNPs are determined by plotting peak intensity (y-axis) against mass (Da) (x-axis). The spectrum of rs12455792 is indicated by a circle. (B) Large vessels CT angiography and 3D scanning images for clinical features of thoracic aortic aneurysm (a, c) and dissection (b, d) patients.