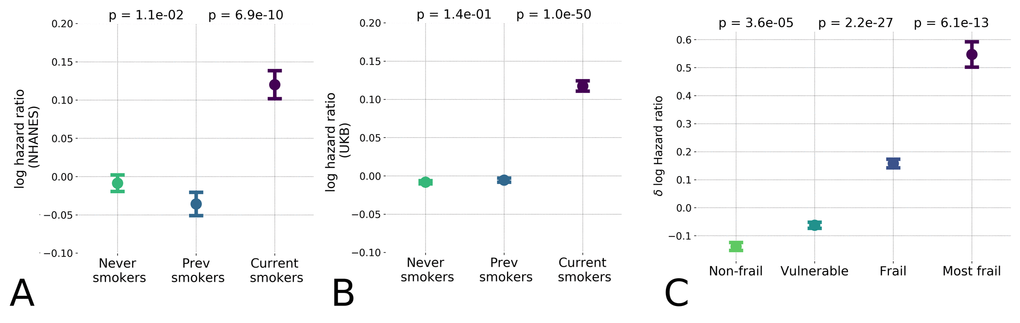
Figure 4.Hazards ratio model distinguished low and high-risk populations and hazardous lifestyles. The effect of unhealthy lifestyle such as smoking caused reversible effect on estimated hazards ratio in the NHANES (A) population and the UK Biobank (B) datasets; (C) Distribution of logarithm of estimated hazards ratio in frailty cohorts shown by median ± standard error of mean (S.E.M.). “Frail” and “most frail” cohorts are stratified on the basis of the respective Frailty Index (FI) values computed according to [2] and are characterized by significant difference in the predicted log-mortality.