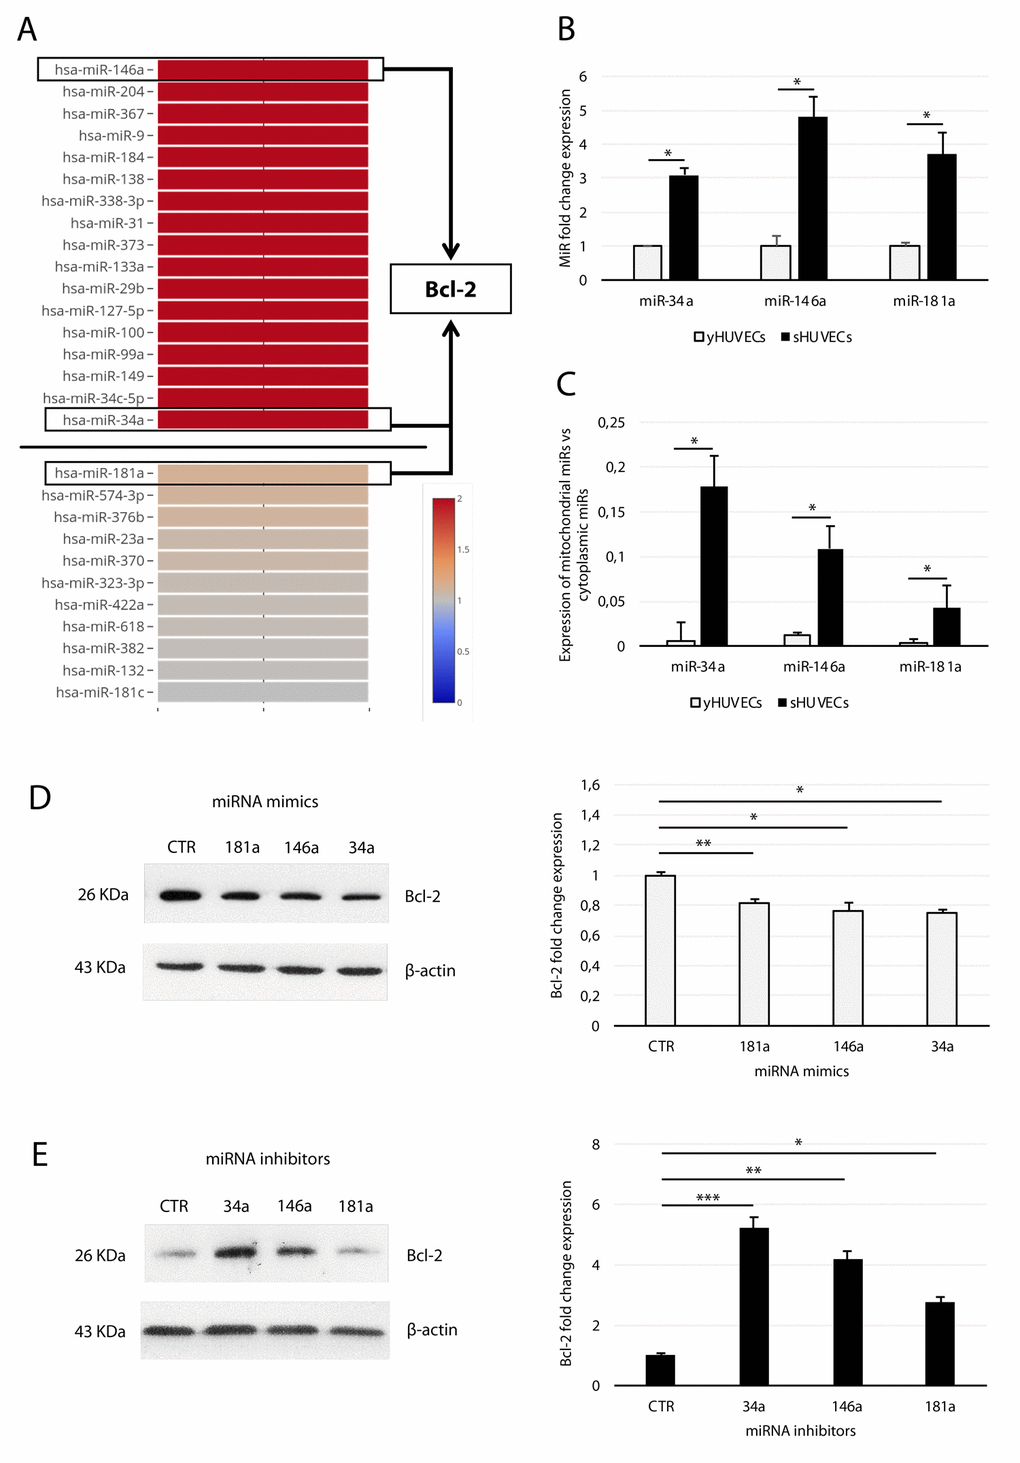
Figure 4.Analysis of miR-34a, -146a, and -181a in sHUVECs and their effect on Bcl-2 expression. (A) Heatmap showing the expression of selected miRNAs in sHUVECs compared to yHUVECs. Expression level of each miRNA is depicted according to the color scale. Adapted from Olivieri et al. [26]. (B) Fold increase of miR-34a, -146a, and -181a in senescent and young HUVECs. (C) Ratio of miR-34a, -146a, and -181a expression in the isolated mitochondrial fraction to the cytoplasmic fraction in yHUVECs and sHUVECs. (D) Western blot and densitometric analysis of Bcl-2 expression in yHUVECs transfected with miRNA mimics (miR-34a, miR-146a, and miR-181a) and negative miRNA mimic control (CTR). (E) Western blot and densitometric analysis of Bcl-2 expression in sHUVECs transfected with miRNA inhibitors (miR-34a, miR-146a, and miR-181a) and negative miRNA inhibitor control (CTR). Protein expression values are reported as Bcl-2 fold change in sHUVECs vs yHUVECs. Data are normalized to β-actin protein expression. Data are mean ± SD of three independent experiments. * t-test p < 0.05, ** t-test p < 0.01, *** t-test p < 0.001 vs CTR.
Figure 4 — The mitomiR/Bcl-2 axis affects mitochondrial function and autophagic vacuole formation in senescent endothelial cells | Aging