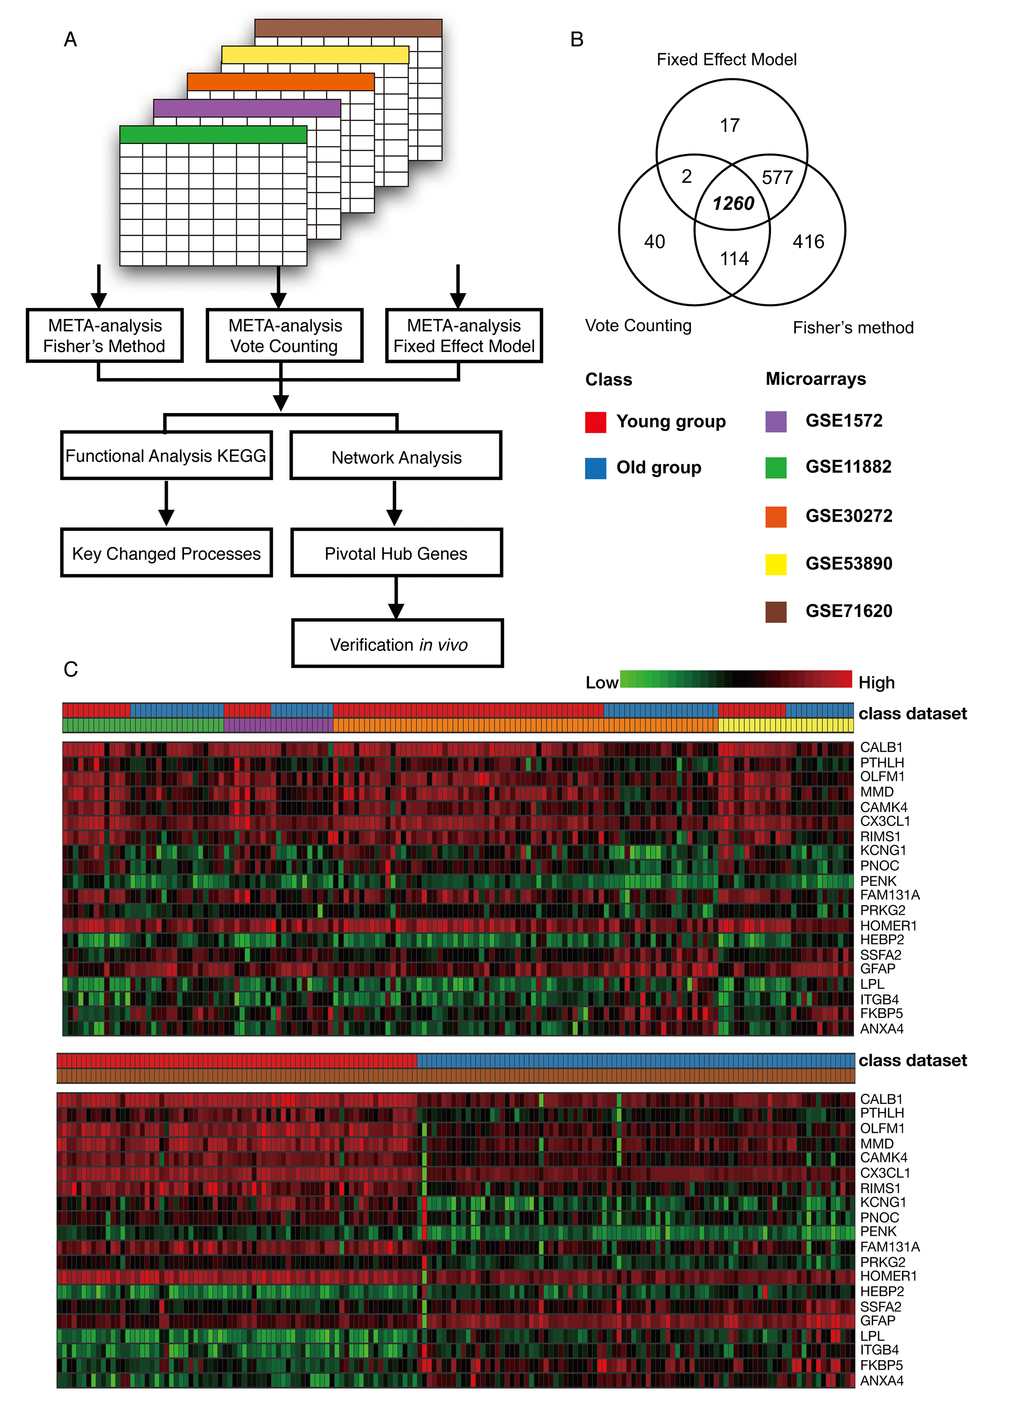
Figure 2.Meta-analysis of the frontal cortex throughout normal aging. (A) Flowchart of the meta-analysis. (B) Venn diagram of differentially expressed genes identified from the meta-analysis using Fisher’s method, the vote counting method and a fixed effect model. (C) Heat map representation of the top 20 differentially expressed genes across different microarrays identified from the meta-analysis (row-wise comparison).