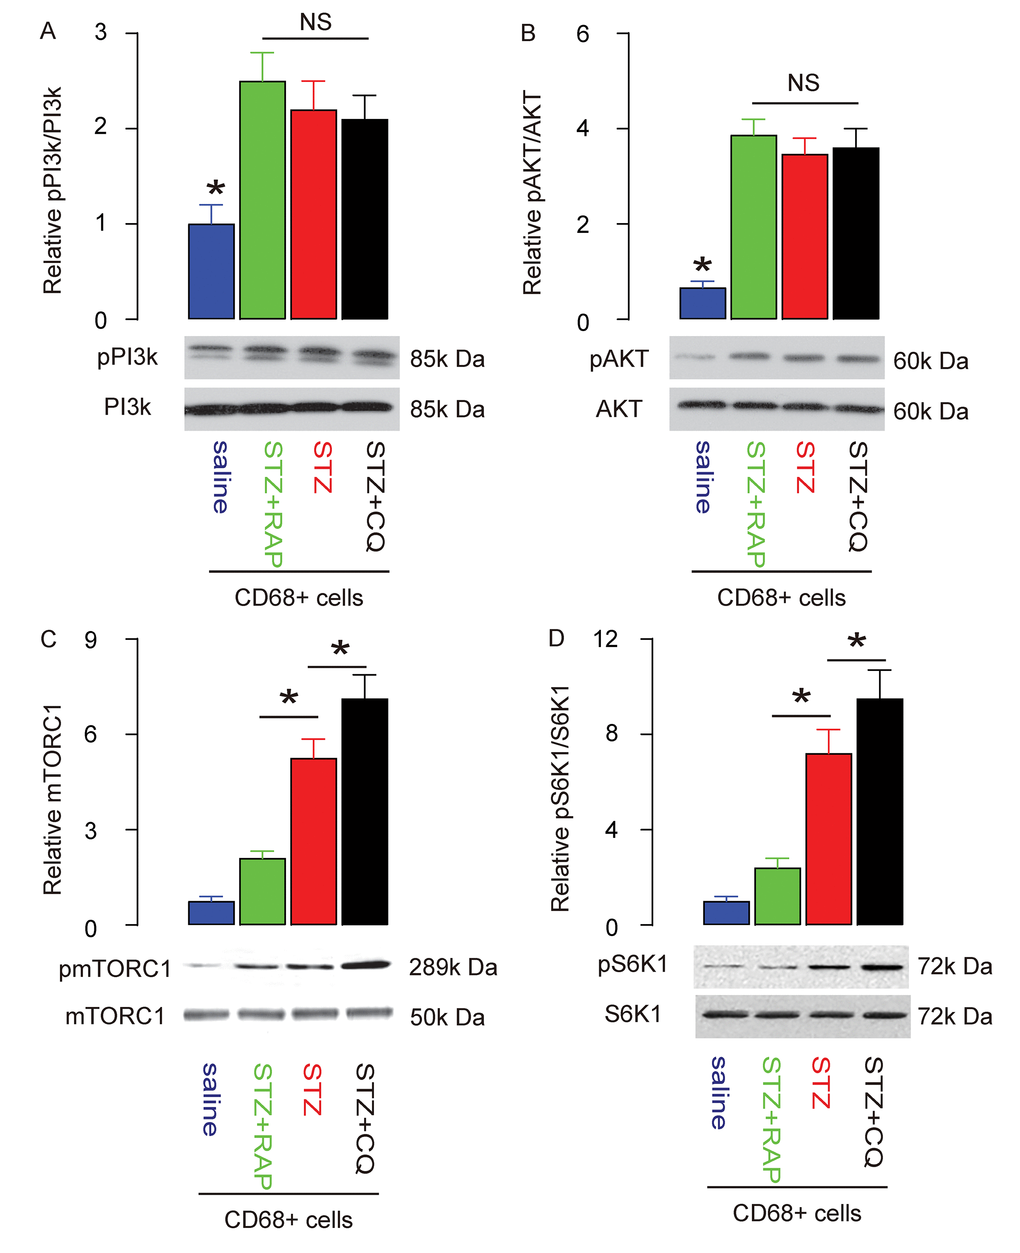
Figure 6.PI3k/AKT/mTOR signalling in RAP/CQ-treated and STZ-treated rat brain macrophages. (A-D) Western blot analysis of activation of PI3k (A), AKT (B), mTOR (C) and S6K1 (D) in brain macrophages from RAP or CQ treated rats. *p<0.05. NS: non-significant. N=10.