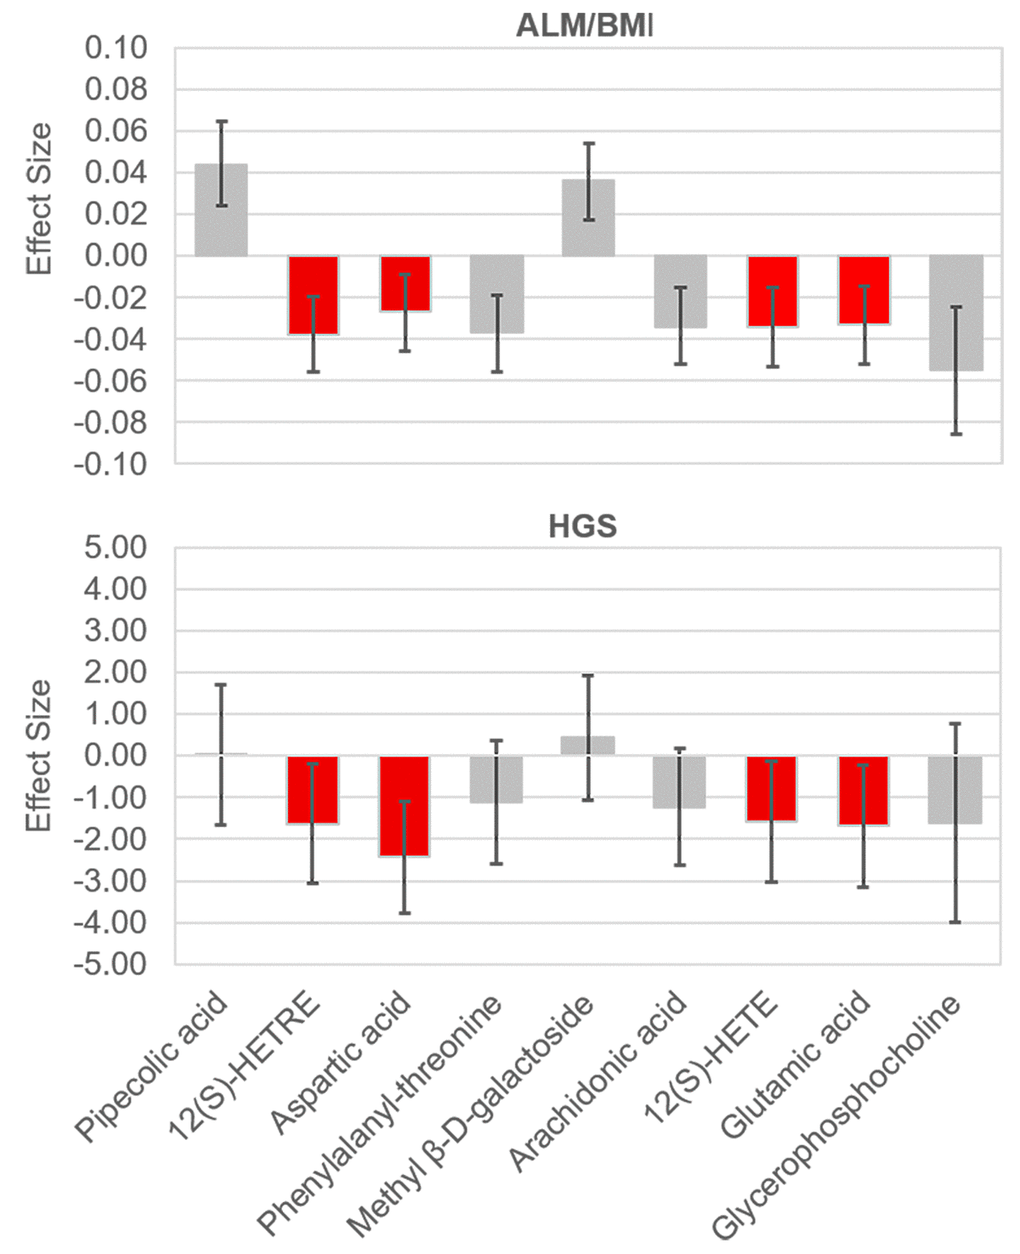
Figure 1.Effect sizes of the significant metabolites on ALM/BMI and HGS. The effects were associated with one standard deviation increase in the relative abundance of a metabolite. The bars show the 95% confidence internal for the effect of each metabolite. The metabolites which were significantly associated with both traits are lighted in red. ALM, appendicular lean mass; BMI, body mass index; HGS, hand grip strength.