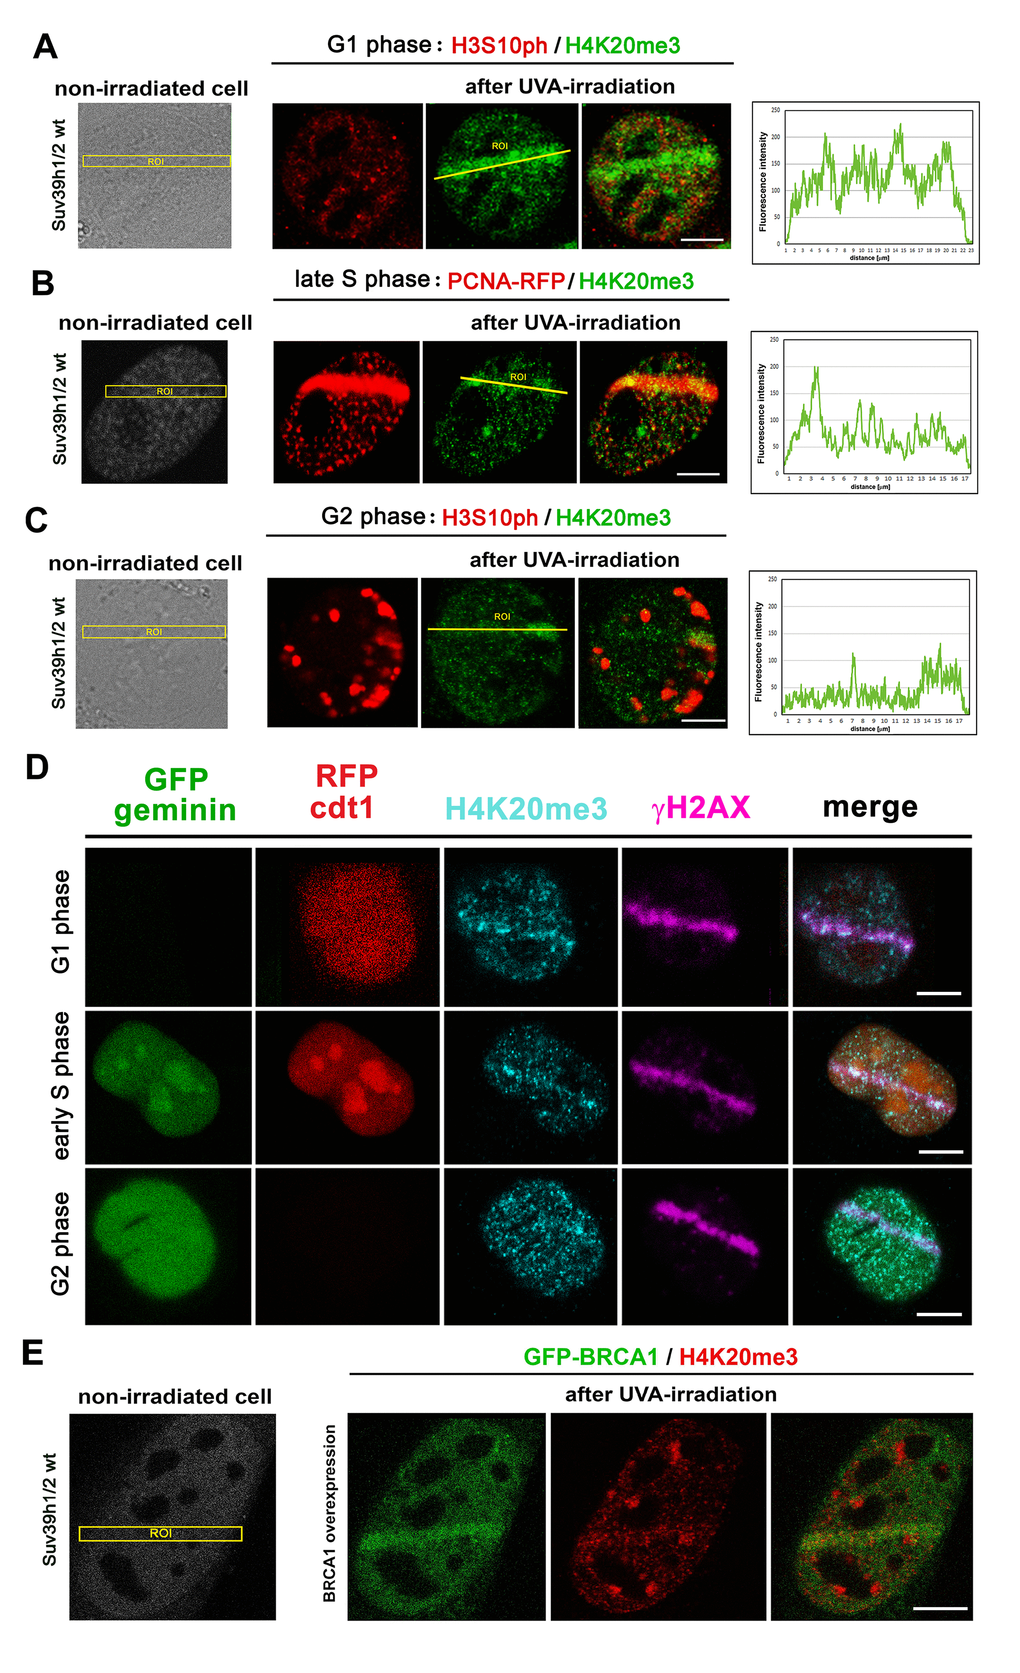
Figure 8.The level of H4K20me3 in cell cycle phases. H4K20me3 in (A) G1, (B) S, and (C) G2 phases of the cell cycle. G1 and G2 phases were determined according to the nuclear distribution pattern of H3S10 phosphorylation: the level of H3S10p is low in the G1 phase characterized by an appearance of tiny H3S10p-positive signals. G2 phase is characterized by robust H3S10p-positive signals in the cell nucleus. The S phase was recognized according to the distribution pattern of the mCherry-tagged PCNA protein that appeared at DNA lesions in the late S phase. The highest level of H4K20me3 at DNA lesions was in the G1 phase of the cell cycle, while cells in S and G2 phases of the cell cycle were characterized by reduced H4K20me3 at micro-irradiated chromatin. Scale bars represent 10 µm. (D) The phenomenon observed in panels A-C was confirmed by the use of the HeLa-Fucci cellular system showing G1 cells expressing RFP-cdt1 and G2 cells with GFP-geminin positivity. The cells in early S phase were subtly positive for both RFP-cdt1 and GFP-geminin. (E) The level of H4K20me3 (red) in mouse fibroblast over-expressing GFP-tagged BRCA1 protein (green). Scale bars in all panels represent 10 µm.