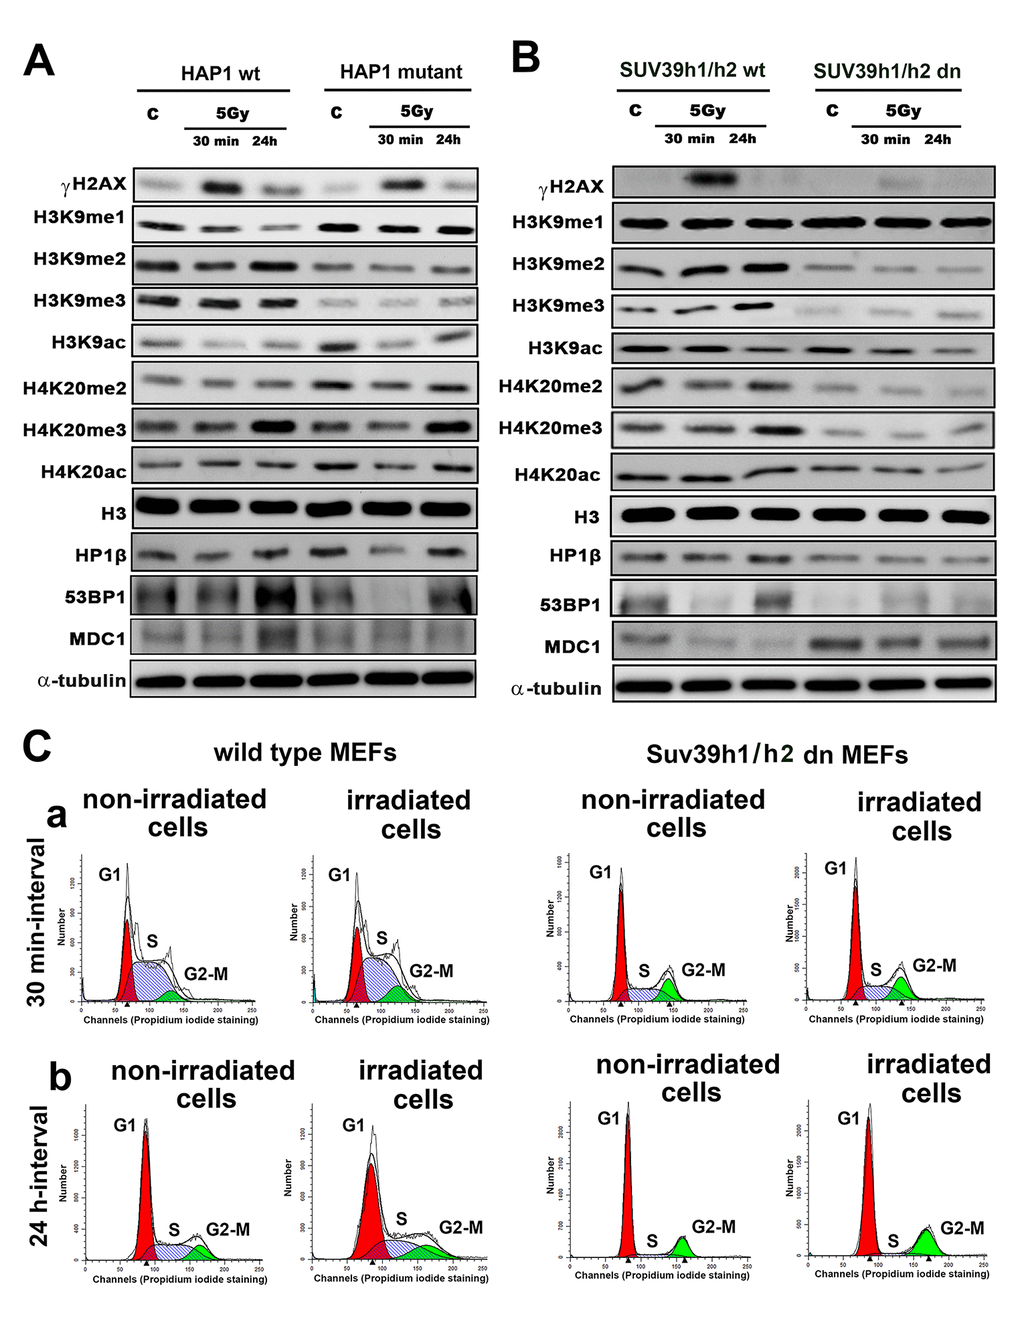
Figure 1.Histone signature in non-irradiated and irradiated cells without and with mutation or deletion in Suv39h1/h2 histone methyltransferases. Western blot analysis of γH2AX, H3K9me1, H3K9me2, H3K9me3, H3K9ac, H4K20me2, H4K20me3 and H4K20 acetylation. The levels of modified histones were normalized to that of total H3 histones. As DNA damage markers, 53BP1, MDC1 proteins, and the HP1β protein were studied and normalized to the level of α-tubulin. Protein levels were studied in (A) HAP1 wt and HAP1 cells with the mutation in the SUV39H1 gene and (B) in wt MEFs and Suv39h1/h2-deficient fibroblasts (MEFs). Non-irradiated cells and cells irradiated by 5 Gy of γ-rays (harvested 30 min and 24 hours after irradiation) were analyzed. (C) Cell cycle profiles were studied by flow cytometry in non-irradiated and γ-irradiated wt MEFs and non-irradiated and γ-irradiated Suv39h1/h2 dn mouse embryonic fibroblasts. Panel (a) shows a 30-min interval, and panel (b) shows a 24-h interval when the cells were harvested after irradiation (and related control samples). Using Mod-Fit software, the percentage of cells in G1 (red peak), S (dash blue peak) and G2-M (green peak) cell cycle phases was calculated. The average cell cycle profile is shown for individual samples, and experiments were performed in 3 biological replicates.