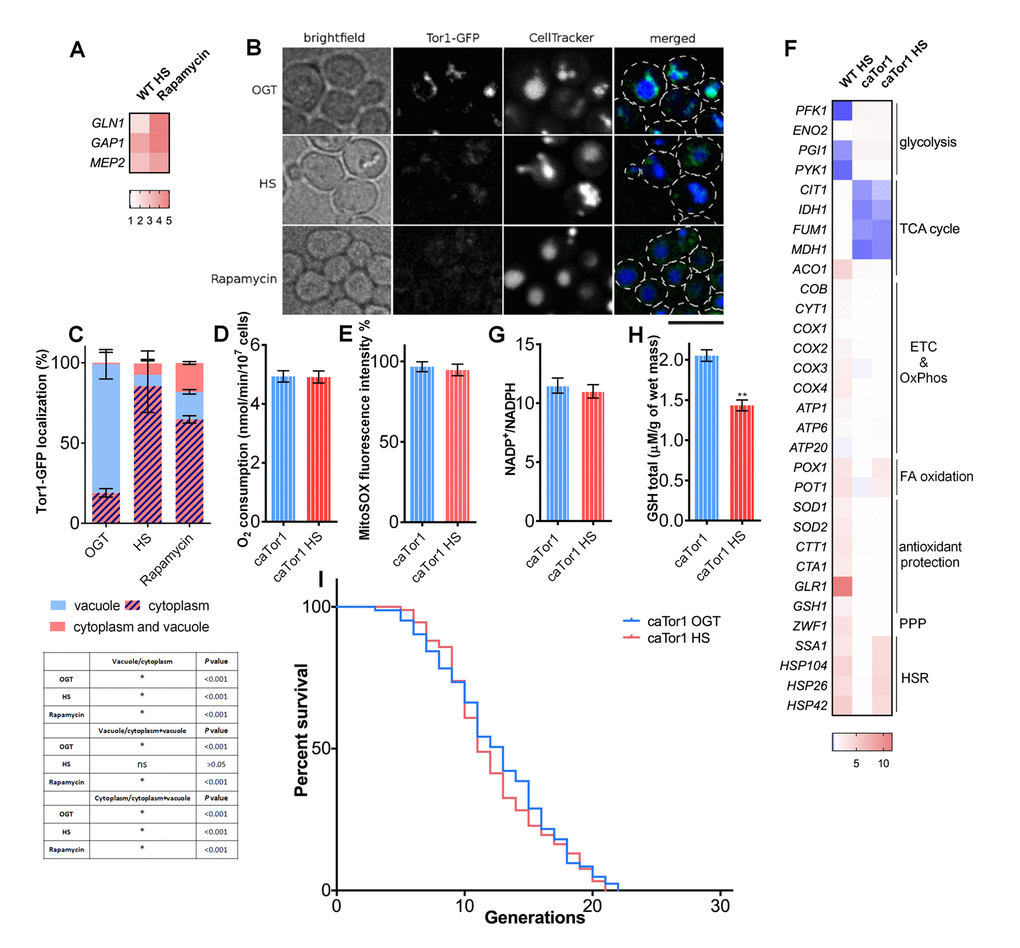
Figure 5.TORC1 inactivation is essential for heat shock-induced activation of respiratory activity. (A) qPCR measurements of expression levels of TORC1 transcriptional targets revealed their upregulation during heat shock, consistent with TORC1 inhibition using rapamycin. (B) Imaging using spinning disc confocal fluorescence microscopy showed deactivation of TORC1 by its displacement from the vacuolar membrane into distinct cytosolic puncta during heat shock and during rapamycin treatment. The black bar represents 5μm (C) Quantification of the cell fractions with differential localization of Tor1-GFP. Data on the graph are mean ± SD from three independent cultures. A minimum of 200 cells was quantified for each condition. P values calculated using multiple t-tests for each condition and shown in the table. *P <0.001. (D) Oxygen consumption remained unaffected during heat shock in the strain with constitutively active Tor1 kinase (E) Mitochondrially produced superoxide (measured by FACS as MitoSOX fluorescence in 10000 cells) was unchanged during heat shock in the strain with constitutively active Tor1 kinase. The results are presented as the percentage of MitoSOX fluorescence detected in WT strain at optimal growth temperature. (F) qPCR measurement of gene expression levels showed that the strain with constitutively active Tor1 kinase exhibited slight increase in levels of glycolytic enzymes and downregulation of TCA cycle compared with WT. (G) NADP+/NADPH ratio was not changed during heat shock in the caTor1 strain. (H) GSH levels were decreased during heat shock in the caTor1 strain. (I) Mean and maximum replicative lifespan (RLS) remain unchanged in caTor1 strain under heat shock. Control cells were kept constantly at 30oC. The number of curated cells is 83 for caTor1 and 92 for caTor1 HS. P value is >0.05 (Mantel-Cox). Unless otherwise stated, data in graphs are mean ± SEM from three biological and three technical replicates. ***P < 0.001; **P < 0.01; *P < 0.05 (ANOVA plus post hoc).