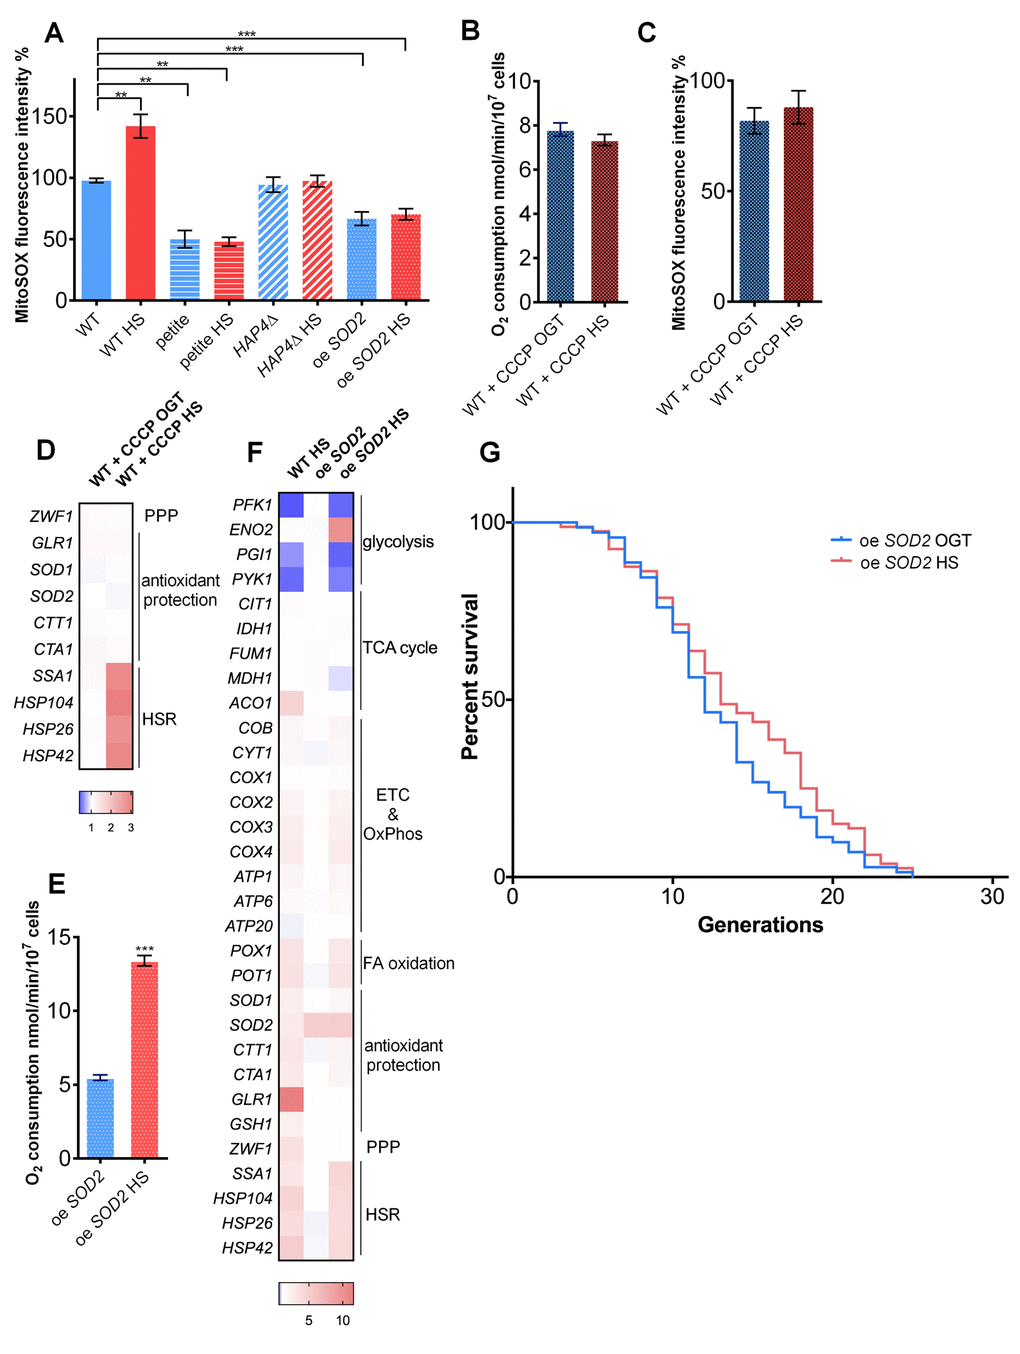
Figure 2.Increased mitochondrial superoxide levels during heat shock activate the pentose phosphate pathway and redox homeostasis maintenance. (A) Mitochondrially produced superoxide (measured by FACS as MitoSOX fluorescence in 10000 cells) increased during HS in WT, but not in petite, HAP4Δ, or oe SOD2 strains. The results are presented as the percentage of MitoSOX fluorescence detected in WT strain at optimal growth temperature. (B) Oxygen consumption increased at optimal growth temperature in the presence of 10 μM CCCP compared with untreated control and remained the same during heat shock. Oxygen uptake was measured polarographically using a Clark-type electrode equipped oxygraph. (C) Mitochondrially produced superoxide (measured by FACS as MitoSOX fluorescence in 10000 cells) decreased in the presence of 10 μM CCCP at optimal growth temperature and was unaffected by heat shock. The results are presented as the percentage of MitoSOX fluorescence detected in WT strain at optimal growth temperature. (D) qPCR measurement of differential gene expression in the presence of mitochondrial uncoupler CCCP (10 μM) showed that respiration activity is required for the activation of the pentose phosphate pathway and redox maintenance during heat shock. Color of the squares on the heat map corresponds to the mean value of the log fold change from three biological and three technical replicates. UBC6 was used for normalization. (E) oe SOD2 strain displayed increased respiratory activity at HS. (F) qPCR analysis of the oe SOD2 strain shows increased levels of SOD2 at both OGT and HS, but no activation of other oxidative stress response enzymes, including G6PD following HS. (G) Mean and maximum replicative lifespan (RLS) remain unchanged in oe SOD2 strain under heat shock. Control cells were kept constantly at 30oC. The number of curated cells is 71 for oe SOD2 and 80 for oe SOD2 HS. P value is >0.05 (Mantel-Cox). Unless otherwise stated, data in graphs are mean ± SEM from three biological and three technical replicates. ***P < 0.001; **P < 0.01; *P < 0.05 (ANOVA plus post hoc).