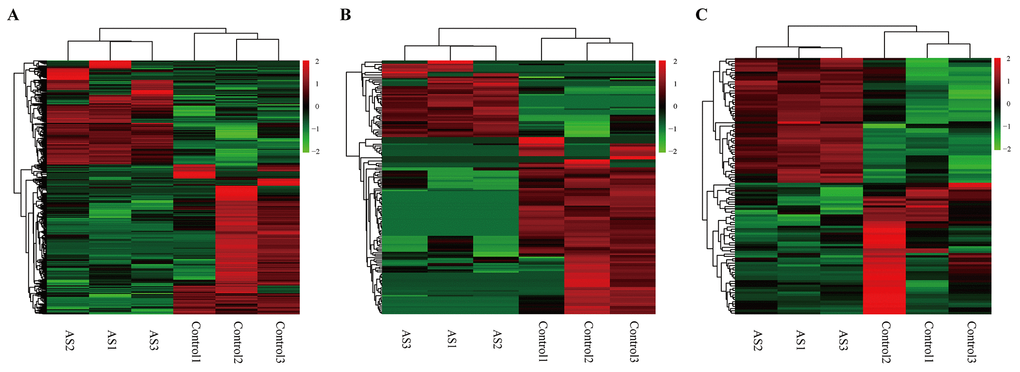
Figure 5.Heatmap showing expression profiles of different RNAs. (A-C) Hierarchical cluster analysis was used to assess the significantly different expressed mRNA, circRNA and miRNAs, respectively (FoldChange > 2 and PValue < 0.05). Red and green denoted high and low relative expression, respectively. Each RNA was represented by a single row of colored boxes and each sample was presently by a single column.