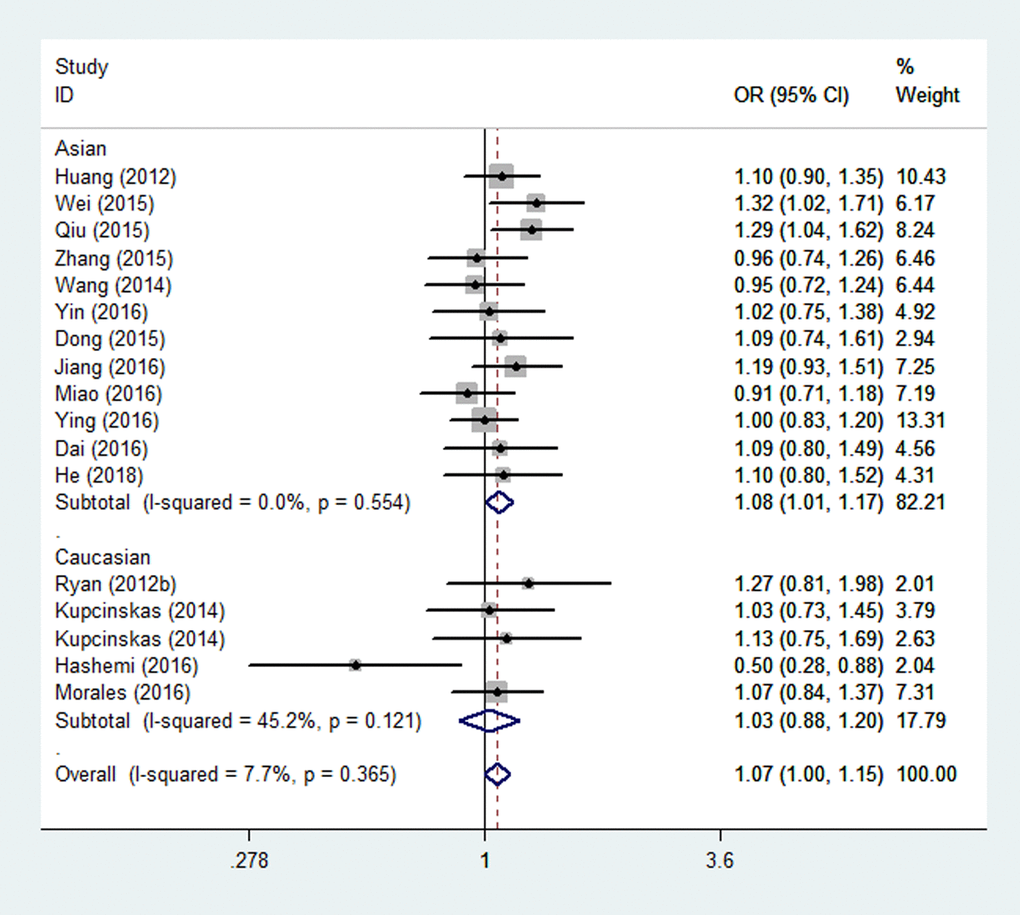
Figure 2.Stratified analysis based on ethnicity for the association between microRNA-608 rs4919510 polymorphism and cancer risk using a heterozygous model (CG vs. CC). The squares and horizontal lines correspond to the study specific OR and 95% CI. The area of the squares reflects the weight (inverse of the variance). The diamond represents the summary OR and 95% CI.