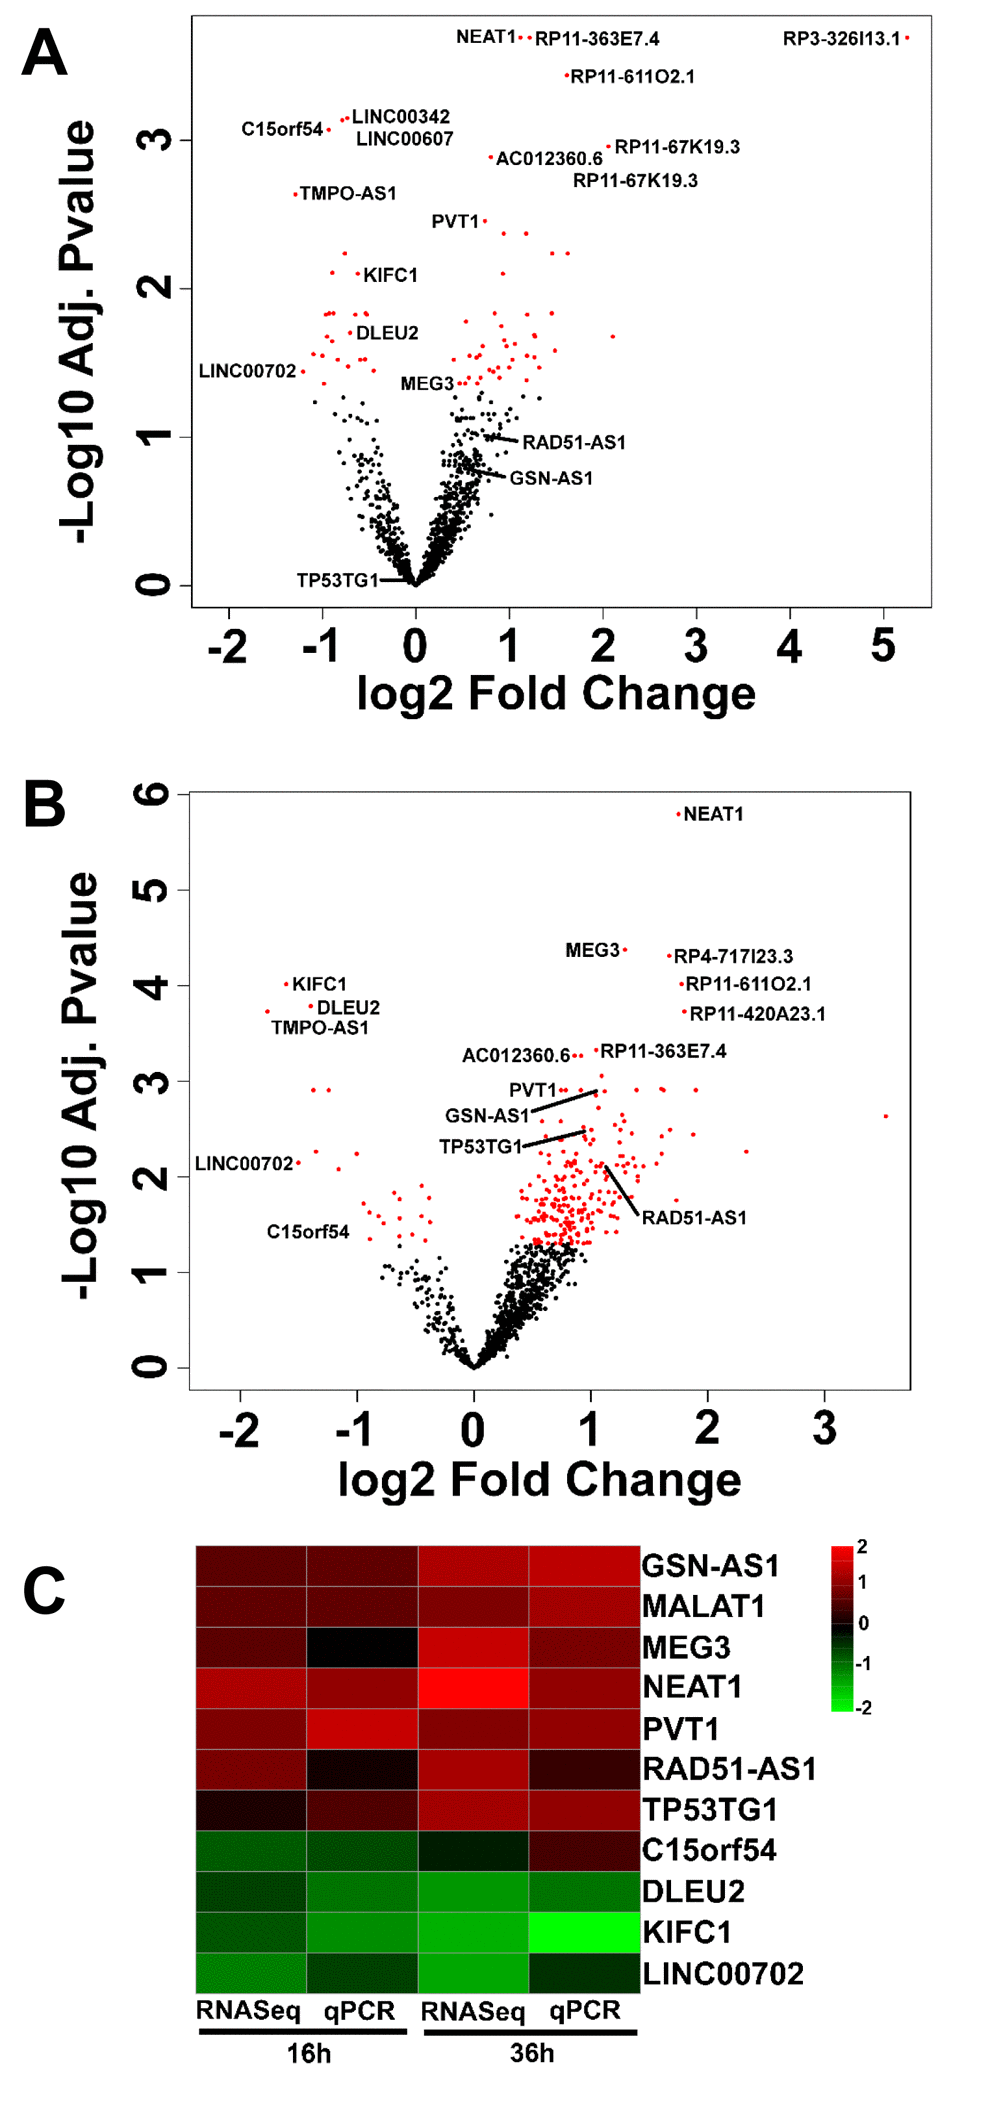
Figure 3.LncRNAs differentially expressed upon HUVEC exposure to H2O2. HUVEC were exposed to H2O2 for 16 hrs (A) and 36 hrs (B) and lncRNA expression was measured by rRNA-depleted RNA-sequencing (n= 3). Volcano plots show adjusted p values in a negative Log10 scale and fold changes in a log2 scale. LncRNAs significantly (adjusted p values <0.05) modulated by H2O2 treatment are indicated in red. The names of top 10 modulated lncRNAs and of qPCR validated lncRNAs are indicated. (C) In independent HUVEC cultures treated as in A and B (n= 3), the modulation of the indicated lncRNAs was assayed by qPCR. The heat map shows modulated lncRNAs as log2 values. Green= down-modulation; red= up-regulation.