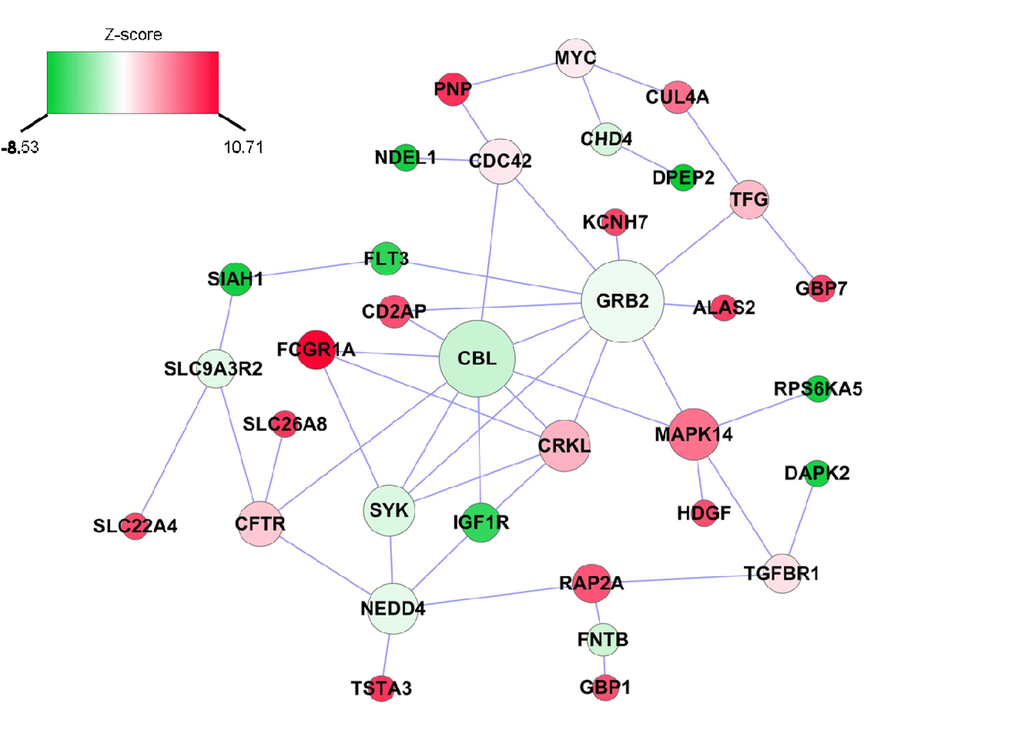
Figure 2.Inflammatory ∆age-related subnetwork derived from protein-protein interaction. Each node represents one gene, whereas each edge represents the interaction between two genes. The nodes were colored to represent their association with inflammatory ∆age by z-score: red represents genes that were positively associated with inflammatory ∆age, whereas green represents genes that were negatively associated with inflammatory ∆age. The node size is proportional to the number of edges that the node connects to.