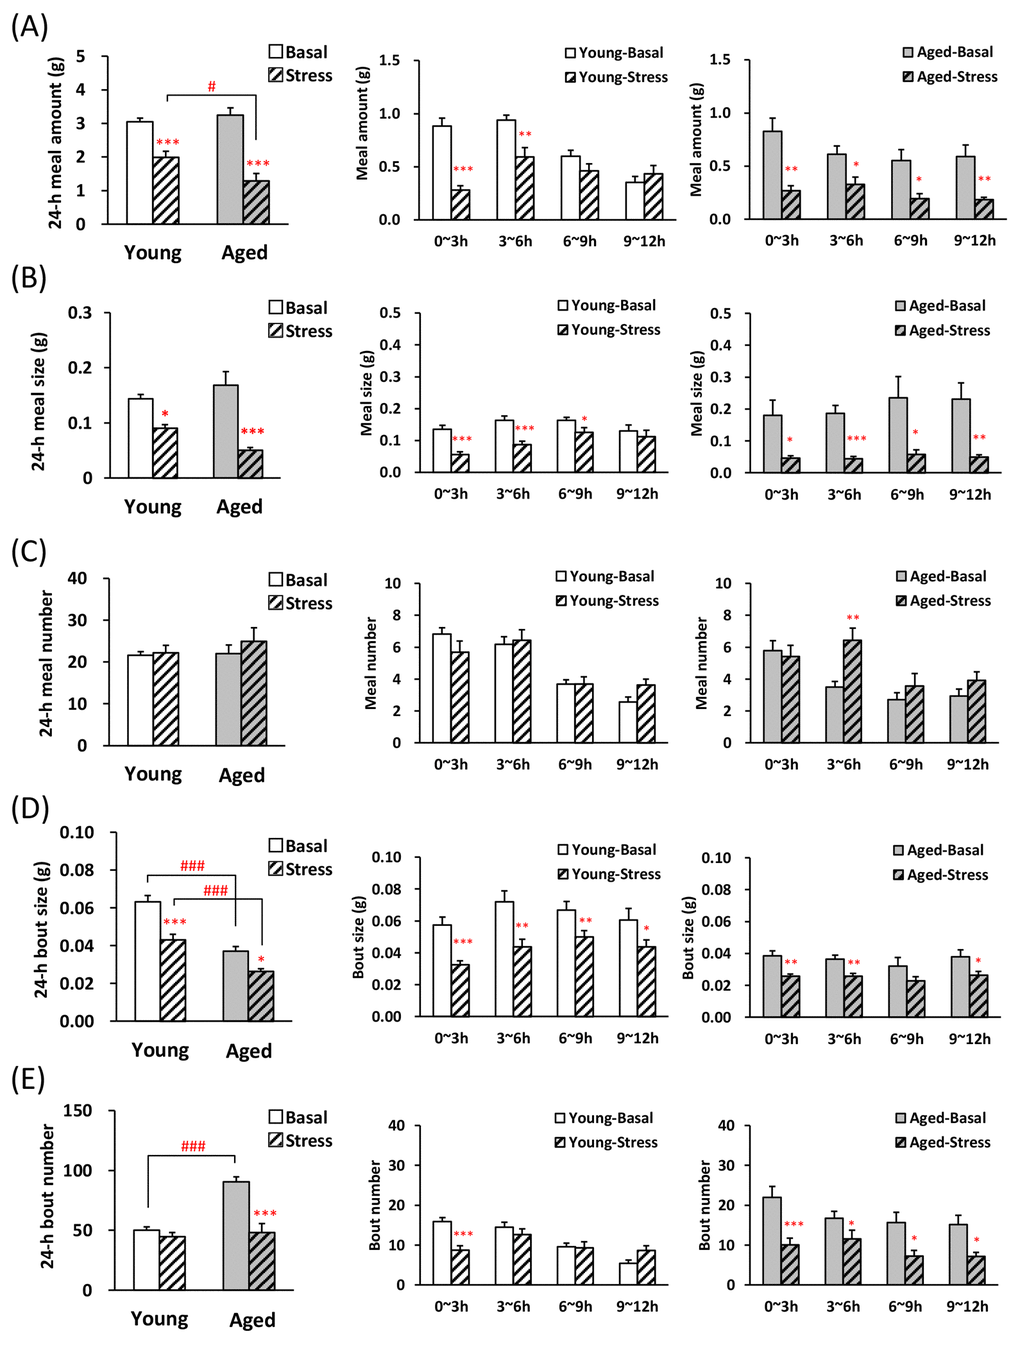
Figure 3.Microstructure analysis of young and aged mice after novelty stress exposure. (A) left: the 24-h meal amount, middle and right: meal amount per 3 h in young and aged mice on dark phase, (B) left: the 24-h meal size, middle and right: meal size per 3 h in young and aged mice on dark phase, (C) left: the 24-h meal number, middle and right: meal number per 3 h in young and aged mice on dark phase, (D) left: the 24-h bout size, middle and right: bout size per 3 h in young and aged mice on dark phase, (E) left: the 24-h bout number, middle and right: bout number per 3 h in young and aged mice on dark phase. *, **, ***; P < 0.05, 0.01, 0.001 vs. age-matched basal mice, #, ###; P < 0.05, 0.001 between young and aged mice, n = 14–16.