Submit an Article
Navigate
Home
Editorial Board
Editorial Policies
Current Volume
Archive
Scientific Integrity
Publication Ethics Statements
Interviews with Outstanding Authors
Newsroom
Sponsored Conferences
Podcast
Contact
Special Collections
Submit an Article
Online ISSN: 1945-4589
Research Paper
|
Volume 9, Issue 10
|
pp. 2209–2222
Senescence-associated ultrastructural features of long-term cultures of induced pluripotent stem cells (iPSCs)
Back to article
Figure 5
(5 of 9)
−
100%
+
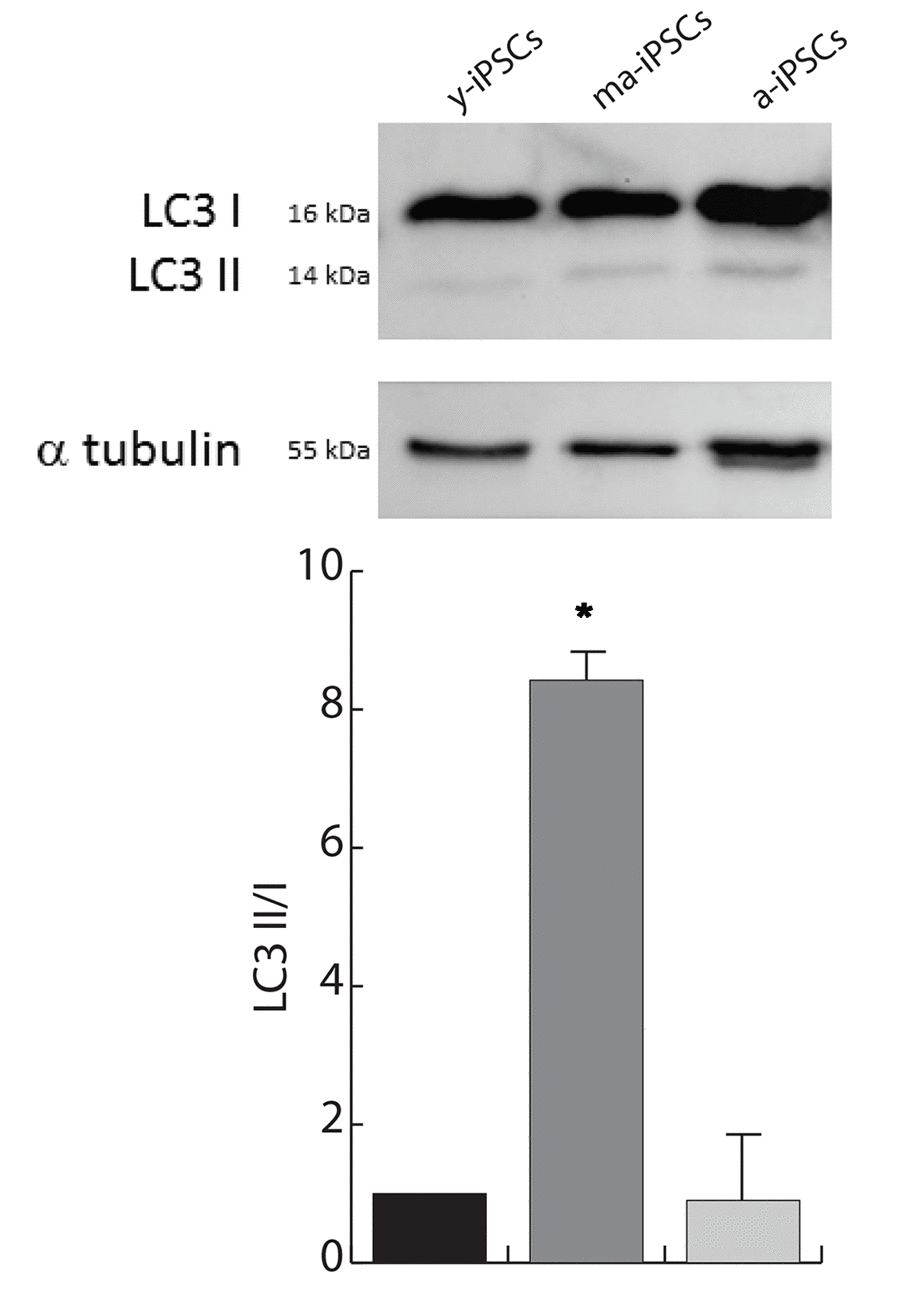
Figure 5.
Autophagy is increased in ma-iPSCs when compared with y- and a-iPSCs. Western blot analysis of LC3 I/II, and alpha-tubulin as loading control is shown. Bar graph shows the LC3–II/I ratio and represents the mean± SD of three experiments.