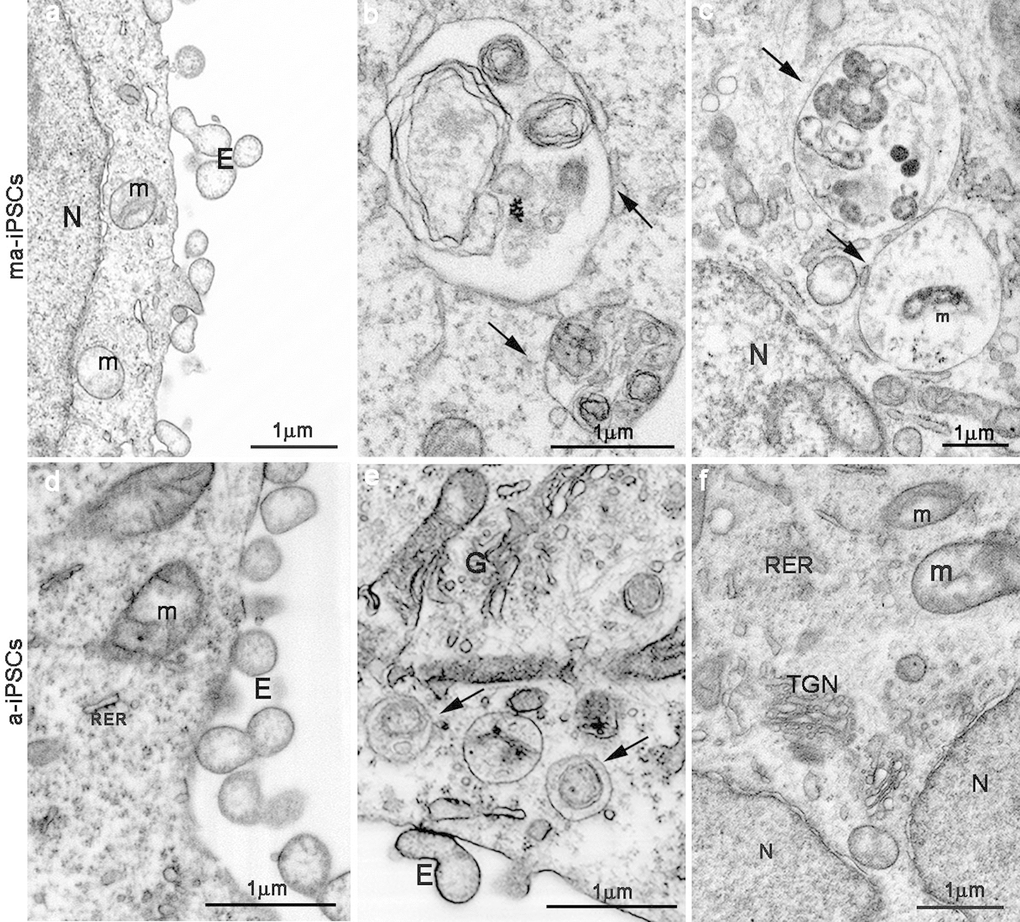
Figure 4.FIB/SEM images showing ultrastructural details of ma- (a-c) and a-iPSCs (d-f). Arrows in b,c,e indicate autophagosomes containing mitochondria (m) or other partially digested cytoplasmic material. E, exosomes; N, nuclei; (TGN, trans-Golgi network; RER, rough endoplasmatic reticulum).