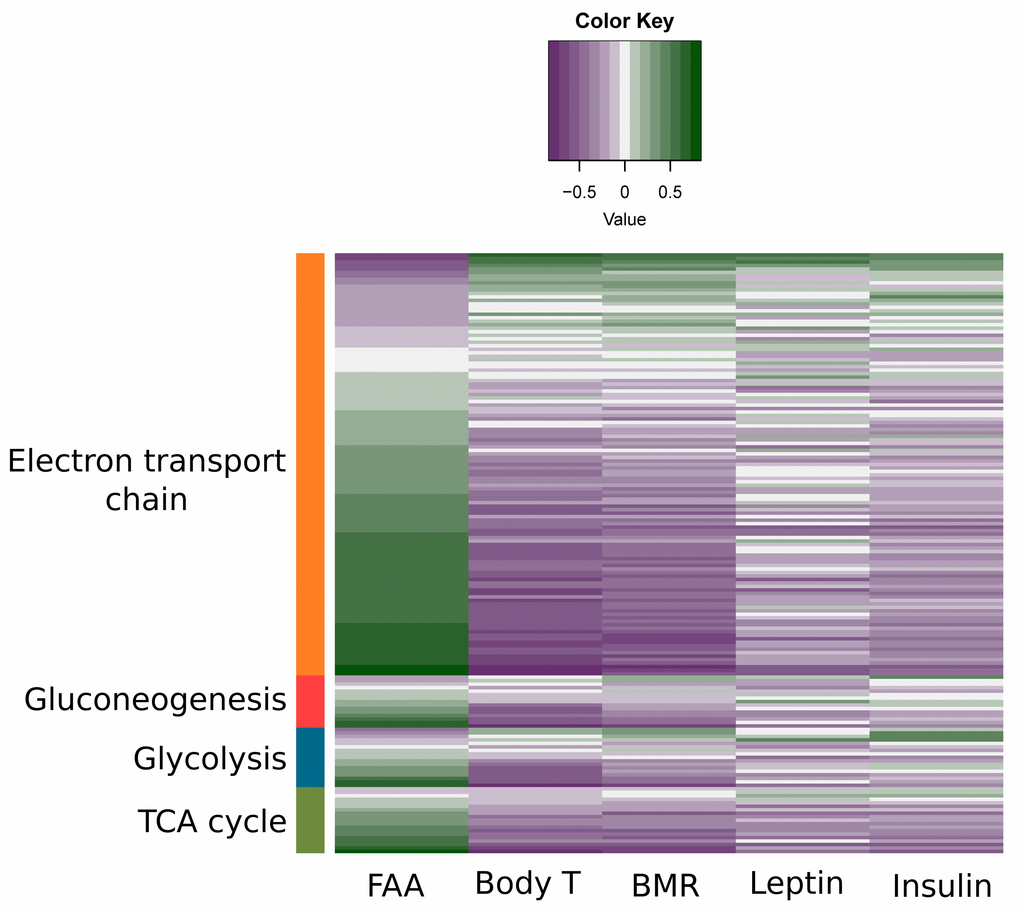
Figure 11.Association between physiological/behavior data and expression levels of genes involved in substrate metabolism. Previously measured leptin and insulin levels, food anticipatory activity (FAA), body temperature (body T) and basal metabolic rate (BMR) [15,16,18,21] for each individual mouse were correlated with the normalized counts of genes involved in electron transport chain, gluconeogenesis, glycolysis and tricarboxylic acid (TCA) cycle. Purple indicates a negative correlation between genes and the measured physiological/behavior data while green indicates a positive correlation.