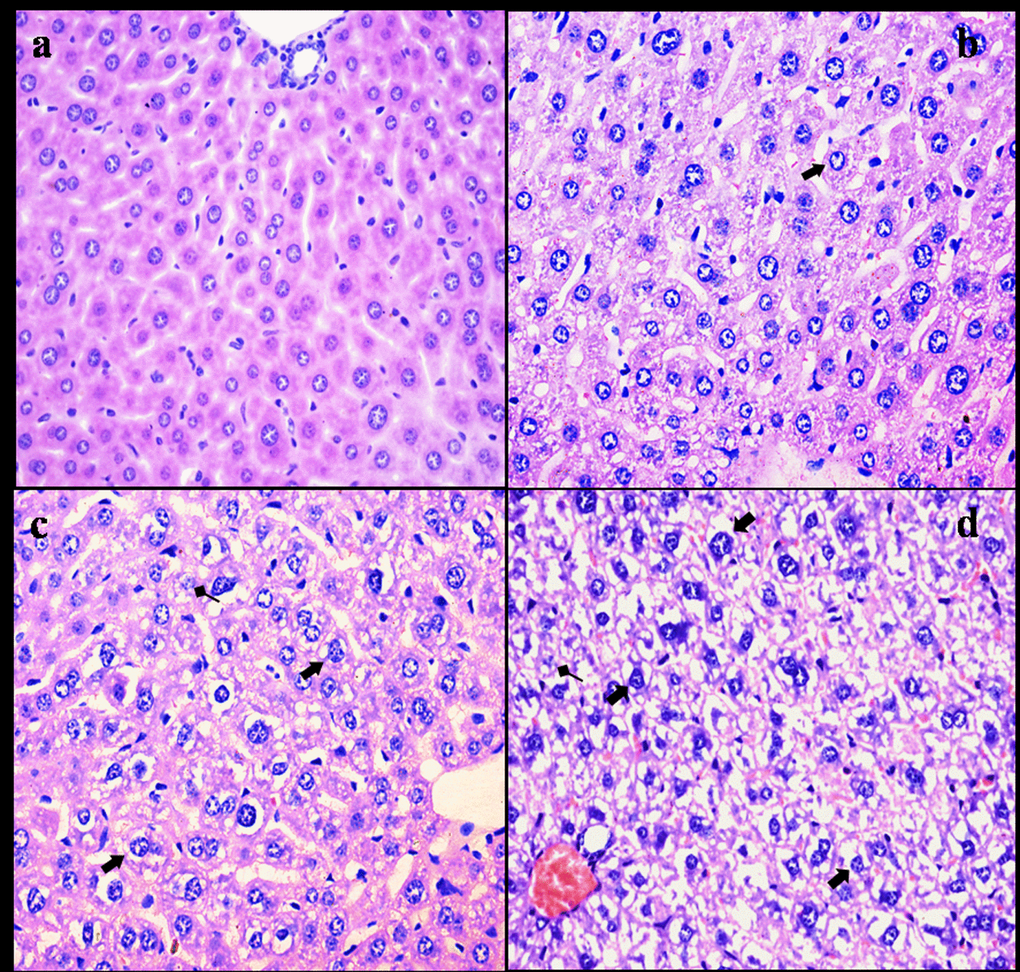
Figure 2.Histopathological changes in the liver at 42 days of the experiment. (a) The control group (H&E × 400). (b) The 12 mg/kg group. Hepatocytes show granular and vacuolar degeneration (⇑, H&E × 400). (c) The 24 mg/kg group. Hepatocytes show obvious granular and vacuolar degeneration (⇑). Also, necrotic hepatocytes are observed (↑, H&E × 400). (d) The 48 mg/kg group. Hepatocytes show marked vacuolar degeneration (⇑). Necrotic hepatocytes are observed (↑). And hepatic cords are disorganized or disappeared (H&E × 400).