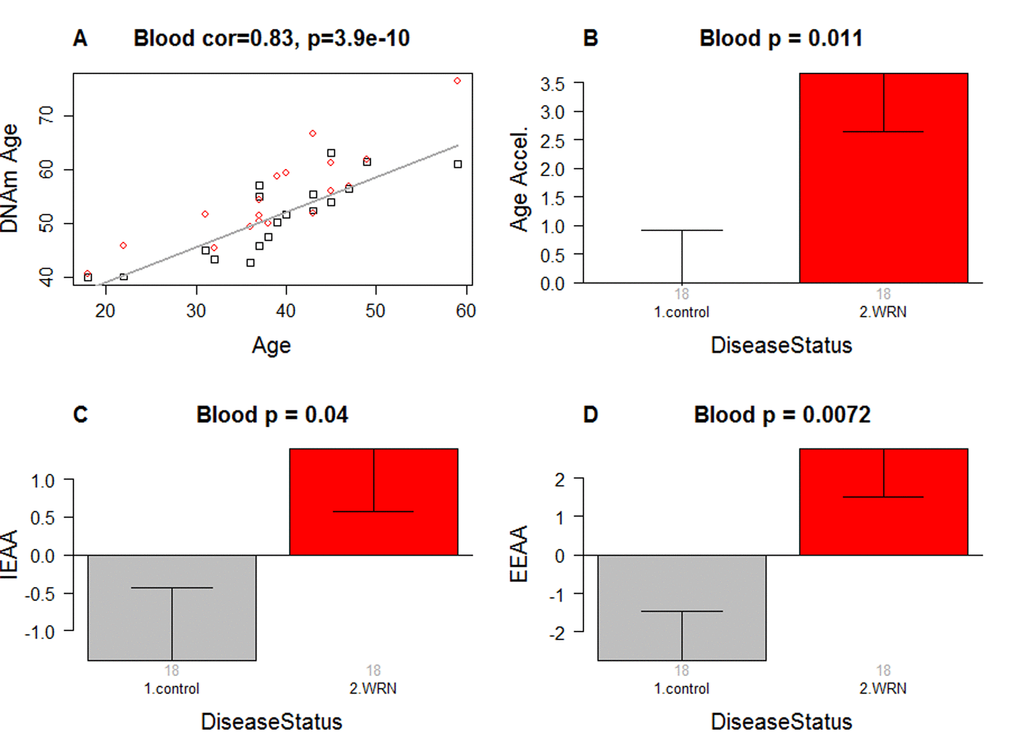
Figure 1.Epigenetic age analysis of Werner syndrome. (A) DNA methylation age (y-axis) versus chronological age (x-axis). Dots correspond to subjects and are colored by WS status (red=case, black=control). We define three measures of epigenetic age acceleration. (B) presents results for the "universal" measure of epigenetic age acceleration, which is defined as residual to a regression line through the control samples, i.e. the vertical distance of a point from the line. By definition, the mean age acceleration in controls is zero. (C) The bar plots relate measures of intrinsic epigenetic age acceleration to WS status. This measure is independent of blood cell counts. (D) shows findings for the measure of extrinsic epigenetic age acceleration, which does relate to changes in cell composition. Each bar plot depicts the mean value (y-axis), 1 standard error, and the group size (underneath the bar). The p-value results from the Kruskal Wallis test, which is a non-parametric group comparison test.