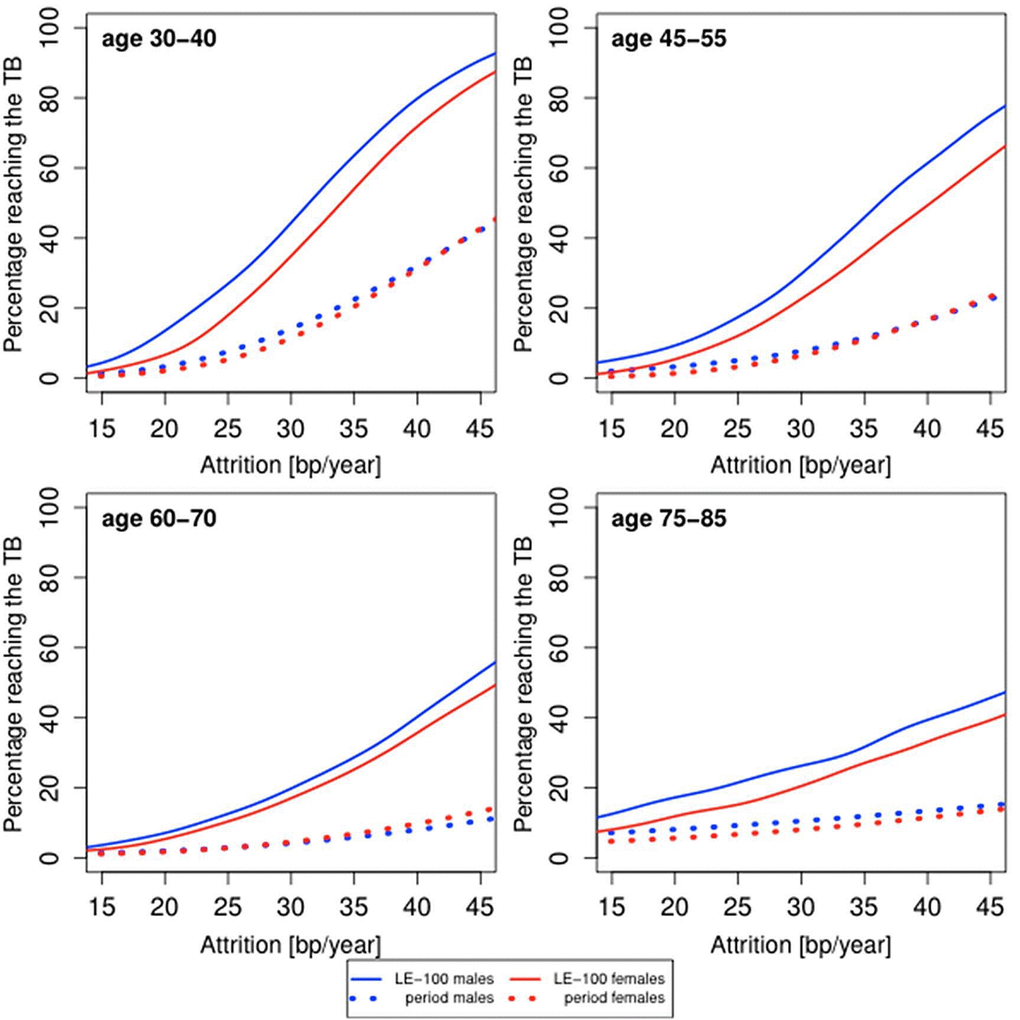
Figure 3.Predicted proportion of the composite study population of males and females reaching the telomere brink (TB; 5 kb) based on period life table mortality (period), life expectancy of 100 years (LE-100), LTL ranking and LTL attrition. The panels display findings for four age groups: 35 years (range 30-40 years); 50 years (range 45-55 years); 60 years (range 55-65 years); 80 years (range 75-85 years), based on different LTL attrition rates (15-45 bp/year).