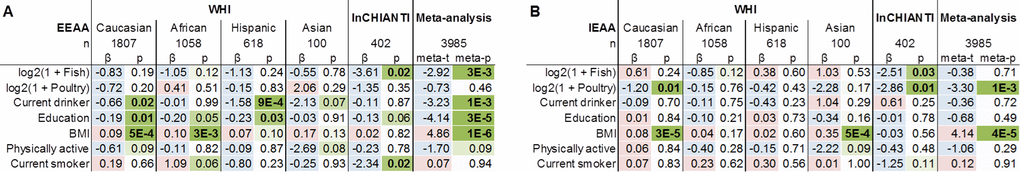
Figure 2.Meta-analysis of multivariable linear models of EEAA and IEAA in the WHI and InCHIANTI. EEAA (panel A) and IEAA (panel B) were regressed on potential confounding factors, fish and poultry intake, and current drinker status for the ethnic strata with sufficient sample sizes (n>100). Individual columns correspond to coefficient estimates (β) colored blue or red for negative and positive values respectively, and p-values (p) colored in green according to magnitude of significance, with the exception of the last two columns which denote Stouffer's method meta-t and meta-p values. Models are adjusted for originating dataset (WHI BA23 or AS315) and for sex (InCHIANTI) .