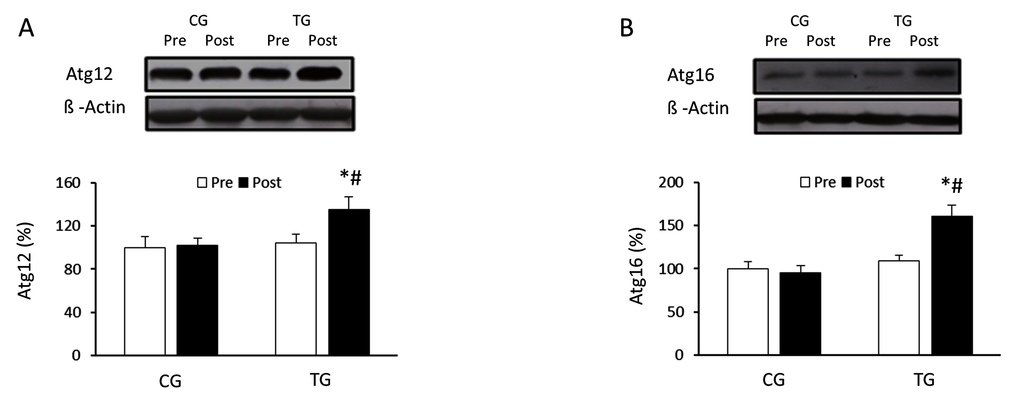
Figure 2.Effects of resistance training on Atg12 and Atg16 expression. Representative Western blots and densitometric quantification of Atg12 (A) and Atg16 (B) in response to 8 weeks of resistance training for TG and the same period of normal daily routines for CG. Protein from PBMCs was separated by sodium dodecyl sulfate-polyacrylamide gel electrophoresis, followed by immunoblotting. Equal loading of proteins is illustrated by β-actin bands. Values are means ± SEM.*p<0.05 vs. CG; #p <0.05 vs. Pre within a group.