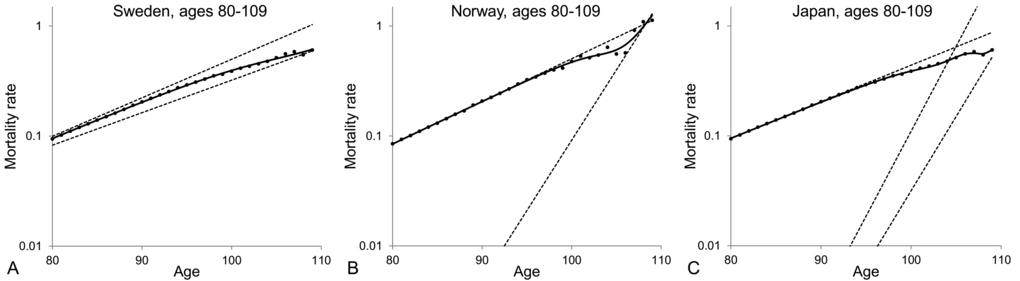
Figure 3.Model of heterogeneous population fitted to averaged 1890-1900 cohort death rates for ages over 80 for Swedish (A), Norwegian (B) and Japanese (C) populations. The dots represent the observed central death rates, while the exponential mortality dynamics of the subpopulations are shown by the dashed lines and the mortality dynamics of the entire population are shown by the black solid lines. Note that the plots are shown on a semi-logarithmic scale.