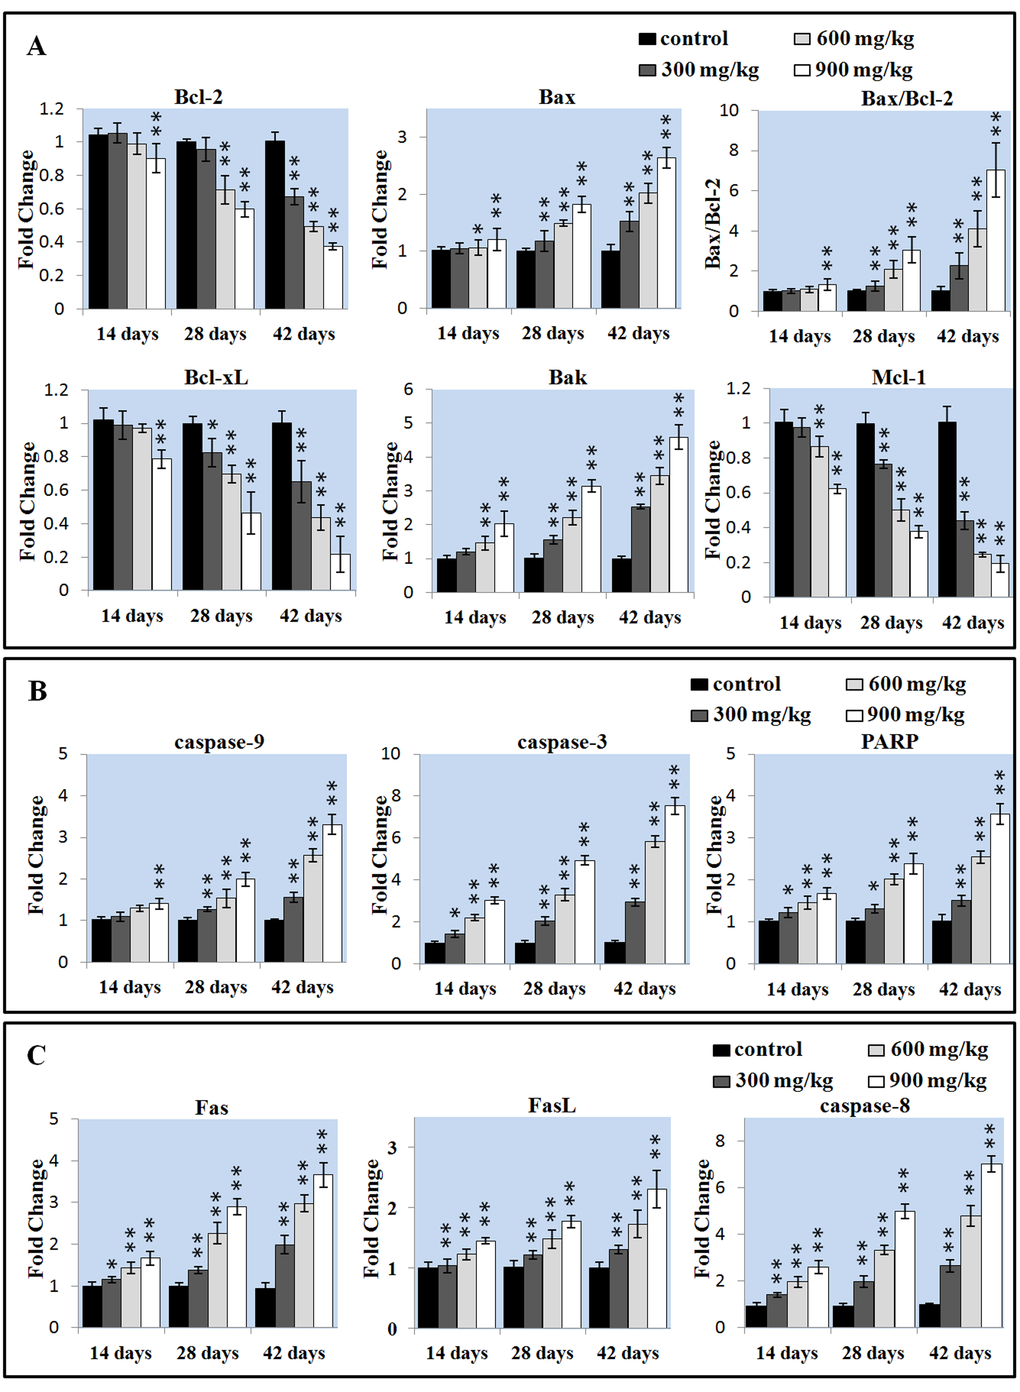
Figure 4.Changes of the apoptotic gene mRNA expression levels in the liver. (A) Changes of the Bcl-2 family proteins mRNA expression levels. (B) Changes of the caspase-9, caspase-3 and PARP mRNA expression levels. (C) Changes of the Fas, FasL, caspase-8 proteins mRNA expression levels. Data are presented with the mean ± standard deviation (n=5). *P<0.05, compared with the control group. **P<0.01, compared with the control group.