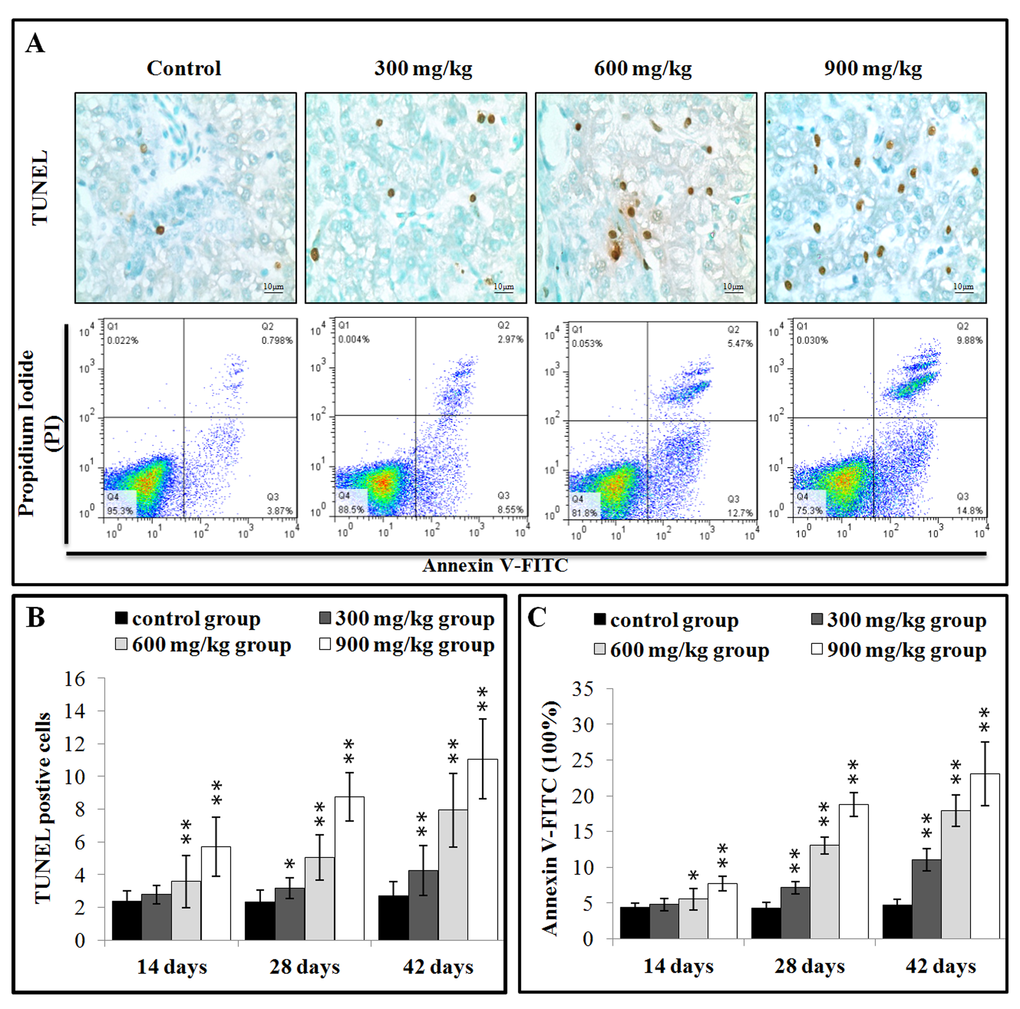
Figure 3.NiCl2 induces apoptosis in the liver. (A) Representative TUNEL and flow cytometric diagram of apoptosis analysis. (B) Changes of the TUNEL positive cells in the liver. (C) Changes of the percentages of annexin V positive cells in the liver. Data are presented with the mean ± standard deviation B:(n=5×5), C: (n=5). *P<0.05, compared with the control group. **P<0.01, compared with the control group.