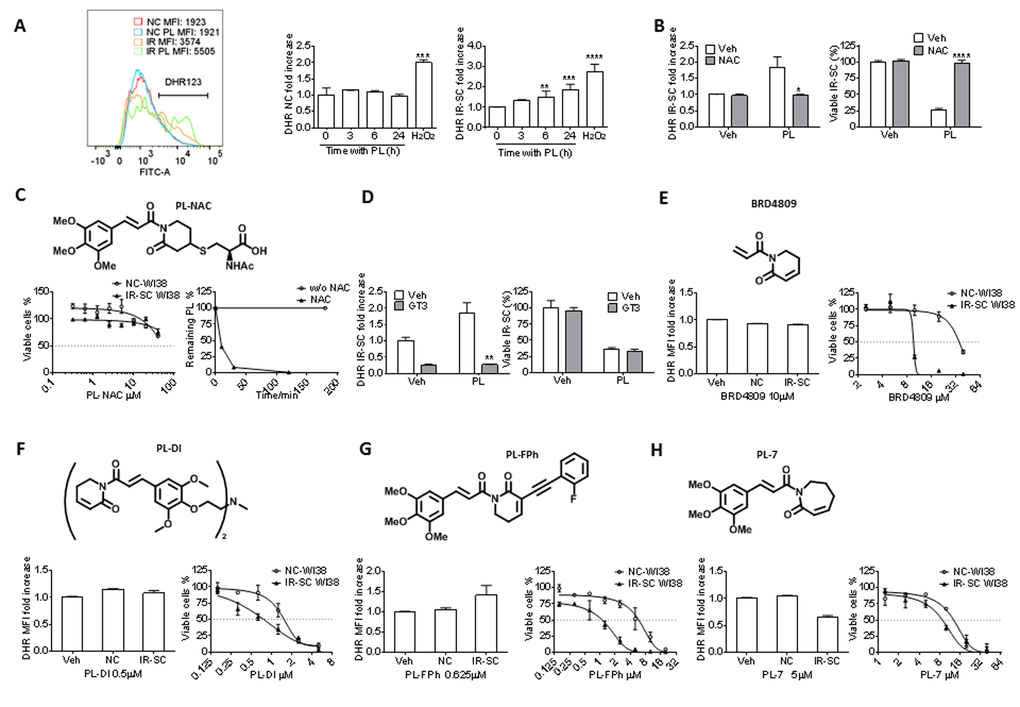
Figure 3.Effect of PL and its analogs on ROS production and senolytic activity in WI-38 IR-SCs. (A) Representative flow cytometric analysis of ROS production in NCs and IR-SCs 24 h after incubation with or without PL by DHR (left) (MFI, mean fluorescence intensity) and quantification of the fold increase of ROS levels in WI-38 NCs and WI-38 IR-SCs cells at the indicated times (middle and right) after incubation with 10 µM PL. As a positive control, cells were treated with 100 µM of H2O2 for 2 h, the H2O2 was removed, and cells were cultured for an additional 24 h (n = 3). (B) Quantification of the fold increase in DHR-123 MFI (left) in WI-38 IR-SCs 24 h after treatment with Veh, 10 µM PL, 2 mM NAC (pretreatment overnight), or the combination of PL and NAC, and (right) the percentage of viable WI-38 IR-SCs 72 h after treatment with Veh, 10 µM PL, 2 mM NAC (pretreatment overnight), or the combination of PL and NAC (n = 3). (C) Structure of PL-NAC and (Left) quantification of viable WI-38 NCs and WI-38 IR-SCs 72 h after treatment with increasing concentrations of PL-NAC (n = 3). (Right) Percentage of 10 µm PL remaining in the culture medium vs. time with or without 2mM NAC. (D) Left panel: quantification of the fold increase in DHR MFI (left) of WI-38 IR-SCs 24 h after treatment with Veh, 10 µM PL, 5 µM γ-tocotrienol (GT3, pretreatment overnight), or the combination of PL and GT3; and right panel: the percentage of viable WI-38 IR-SCs 72 h after treatment with Veh, 10 µM PL, 5 µM GT3 (pretreatment overnight), or the combination of PL and GT3 (n = 3). (E-H) Quantification of the fold increase in DHR-123 MFI after 24 h treatment (left) and viability of WI-38 NCs and WI-38 IR-SCs 72 h treatment (right) after they were treated with increasing concentrations or (E)10 µM BRD4809, (F) 0.5 µM PL-DI, (G) 0.625 µM PL-FPh, and (H) 5 µM PL-7 (n = 3). Data are represented as the mean ± SEM.