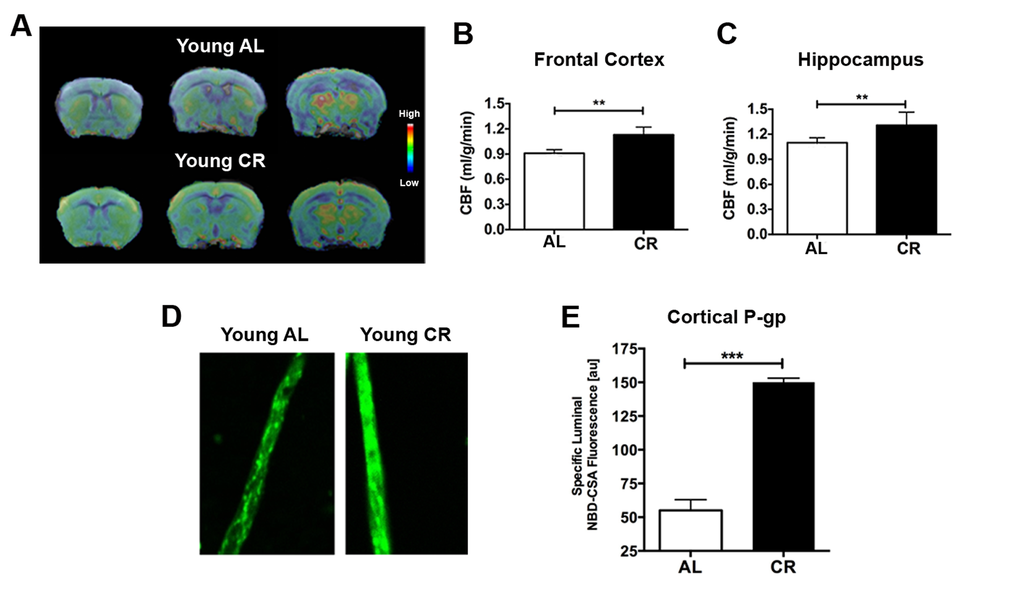
Figure 1.Caloric restriction enhances neurovascular functions in young mice. (A) CBF maps superimposed on structural brain images; the color code indicates the level of CBF in a linear scale. Quantitative CBF (ml/g/min) obtained from (B) Frontal Cortex and (C) Hippocampus. (D) Representative confocal images showing increased luminal accumulation of NBD-CSA fluorescence (green) in brain capillaries isolated from young CR mice; shown in arbitrary fluorescence units (scale 0-255). (E) Corresponding quantitative fluorescence data. Data are mean ± SEM. **p < 0.01; ***p < 0.001; n.s.: non-significant; AL: ad libitum; CR: caloric restriction.