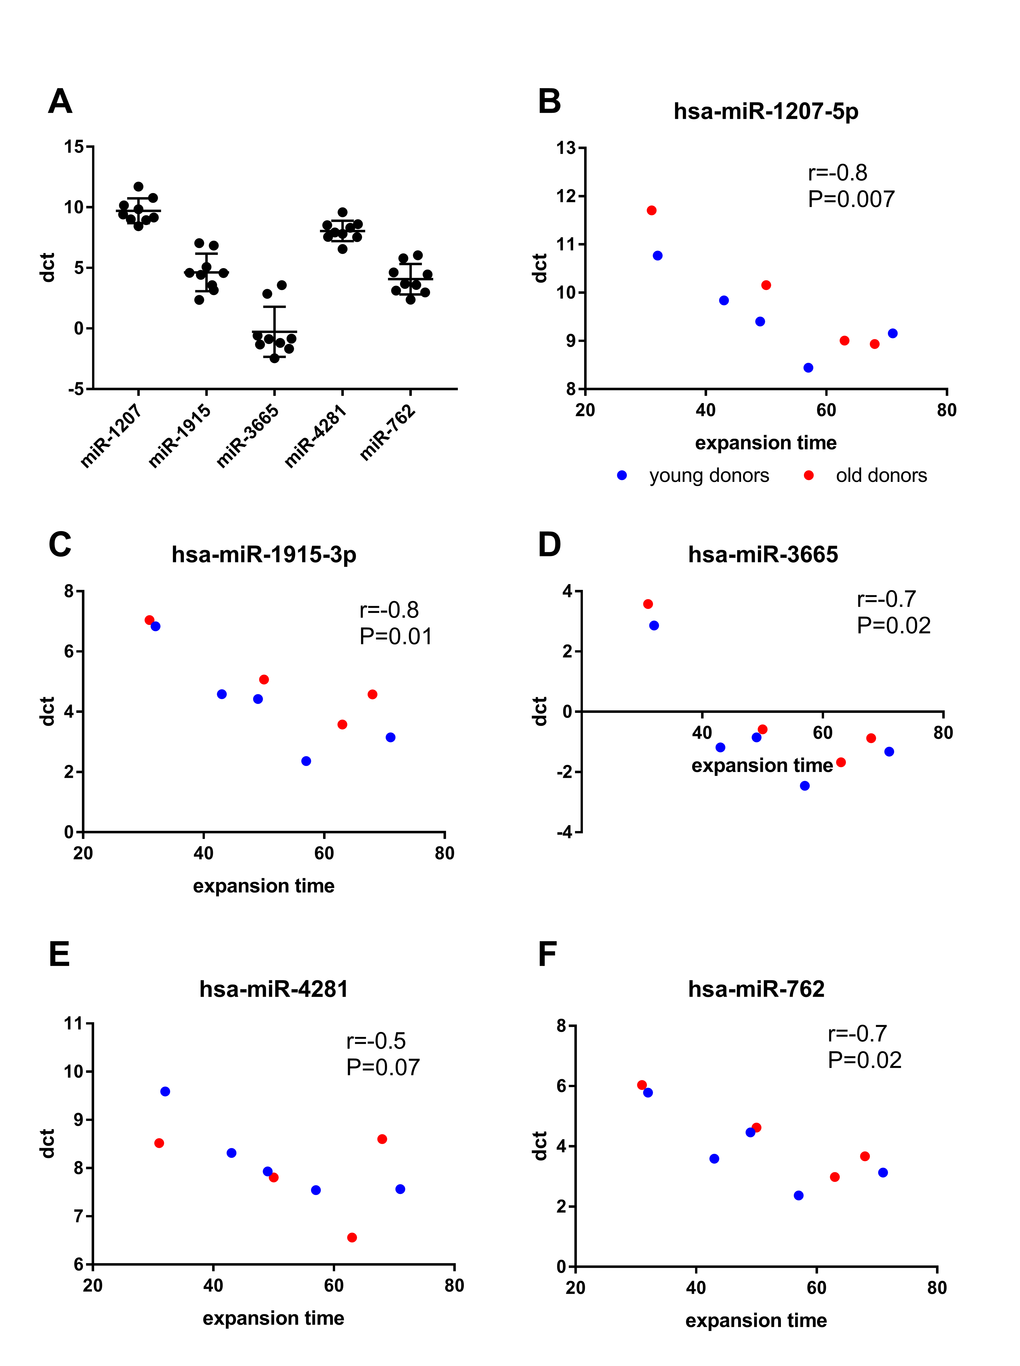
Figure 3.Correlation analyses between miRNA expression and expansion time. (A) scatter plot of dct values of individual miRNAs at passage 8. (B-F) Correlation of dct at passage 8 with the expansion time (days) was calculated using spearman’s correlation. Lower dct corresponds to higher miRNA expression.