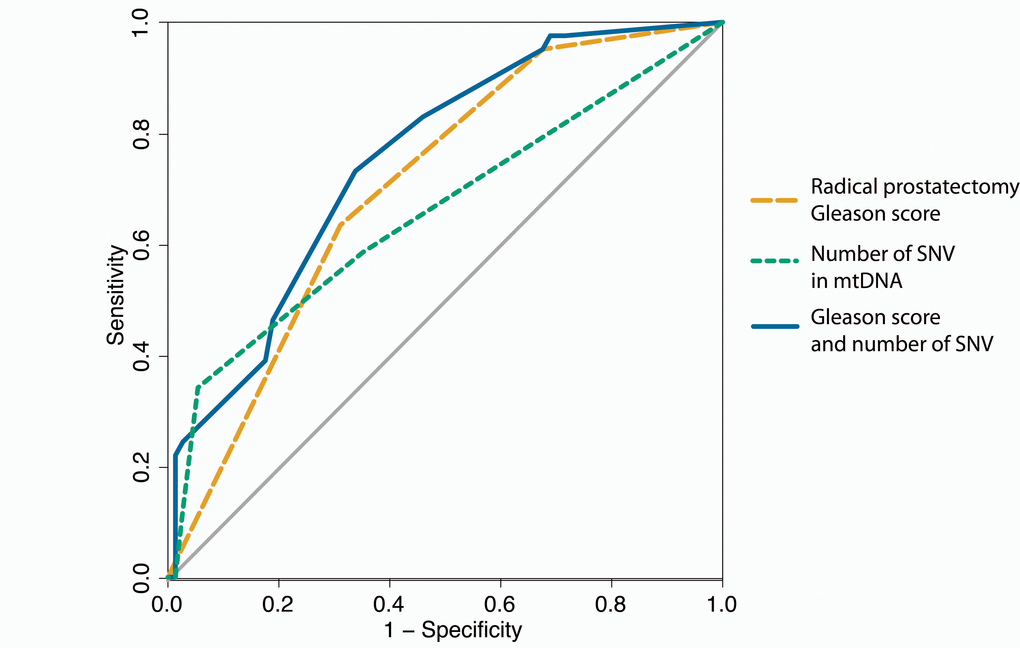
Figure 4.ROC curves for predicting disease relapse. In orange disease relapse predicted by Gleason score of the radical prostatectomy alone (AUC = 0.704), green for number of single nucleotide variants (SNVs) in mtDNA alone (AUC = 0.659) and in blue the Gleason score combined with the number of mtDNA SNVs (AUC = 0.752).