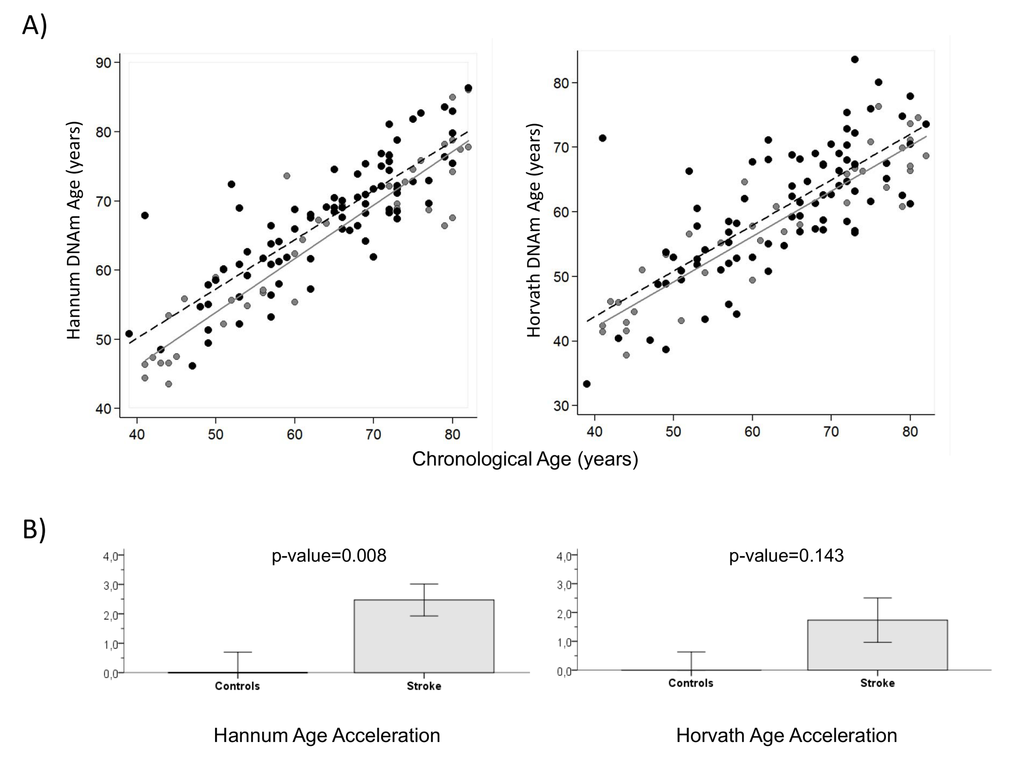
Figure 2.DNA methylation Age (A) Hannum and Horvath versus chronological age in blood samples. Grey and black circles in the scatterplot denote samples from controls and cases, respectively. The grey line represents a linear regression line through control samples. The black dashed line represents a linear regression line through IS cases. For each subject, age acceleration is defined as the vertical distance to the grey line. The bottom row (B) shows how mean age acceleration (y-axis) relates to IS status, with p-value of ANOVA test. By definition, the mean age in controls is zero. Each bar plot reports 1 SE.