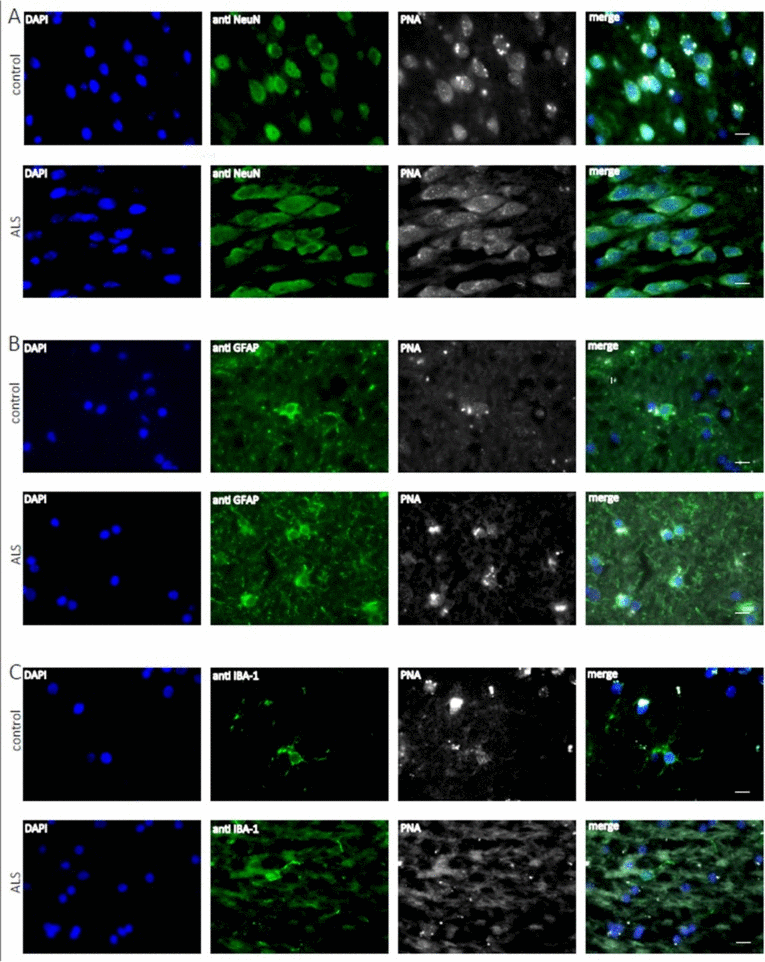
Figure 1.Telomere length analysis of human hippocampal ALS and control tissue at the cellular levelRepresentative fluorescence images from the hippocampus from ALS patients and non-neurologic controls showing telomere specific PNA-probe Cy3-OO (CCCTAAA)3 (white), DAPI staining (blue) and in green NeuN positive neurons (A), astroglia positive GFAP cells (B) and microglia positive Iba I cells (C).