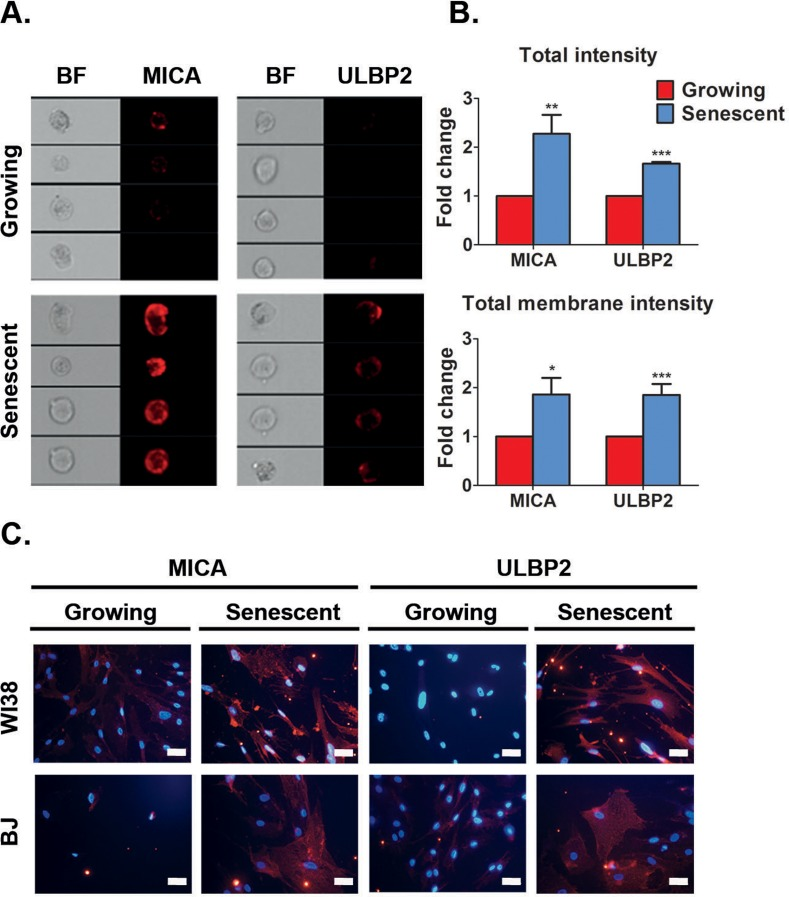
Figure 2.Senescent cells upregulate MICA and ULBP2 on the cell surface(A) ImageStream analysis demonstrates higher expression levels of MICA and ULBP2 on the cell surface membrane of DIS IMR-90 fibroblasts (Senescent) compared to control (Growing) cells. (B) Quantification of total intensity and total membrane intensity indicate higher levels of MICA and ULBP2 in DIS IMR-90 cells compared to growing (control) cells. (C) Representative immunofluorescence staining of MICA and ULBP2 performed on non-permeabilized cells demonstrates higher expression levels of these proteins on the cell surface membrane in DIS WI38 and BJ cells compared to growing (control) cells. Scale bar: 50μm. MICA and ULBP2 are shown in red. DAPI is shown in blue. Data presented as mean with S.E.M of three independent experiments. Two-tailed t-test *P<0.05, **P<0.001, ***P<0.0001.