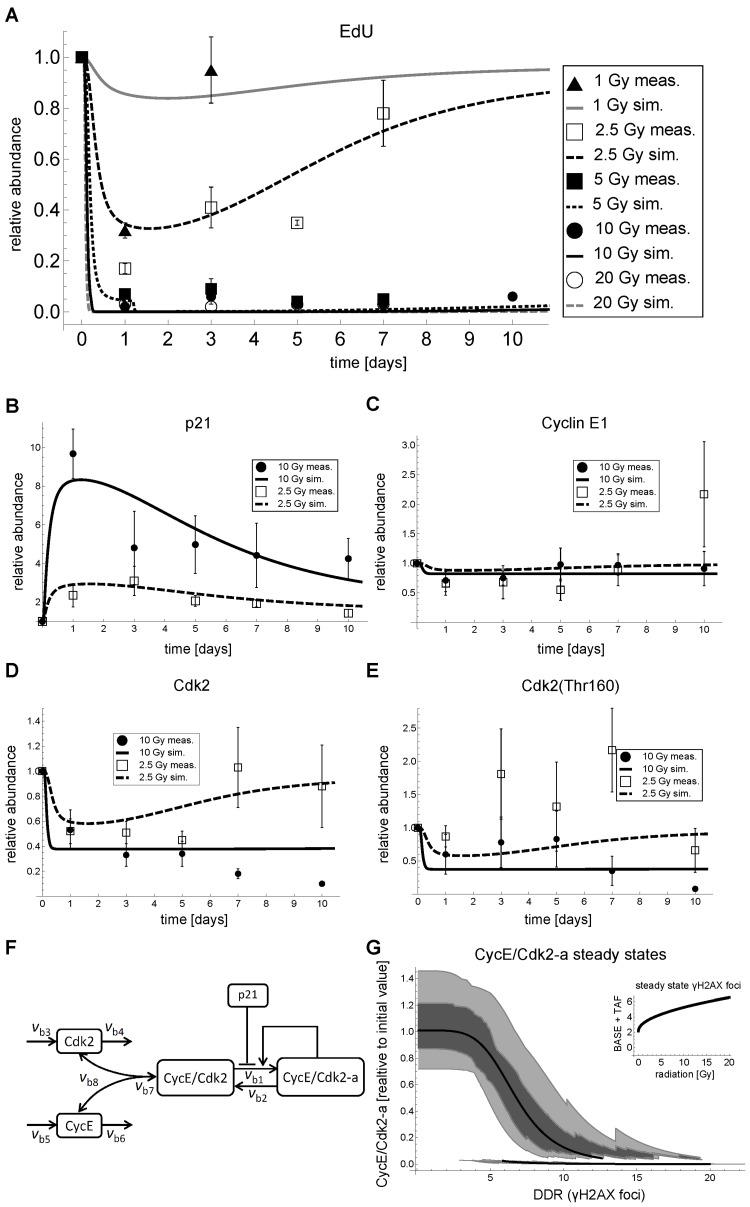
Figure 3.G1-S dynamics and model fits in MRC5 cells after IR. (A) Relative abundance of EdU positive cells and simulated active Cyclin E/Cdk2 complex (CycECdk2-a in panel F). (B) Measured and simulated relative total p21 abundance (p21 in F).(C) Measured and simulated relative total Cyclin E1 abundance (CycE+CycE/Cdk2+CycE/Cdk2-a in panel F). (D) Measured and simulated relative total Cdk2 abundance (Cdk2+CycE/Cdk2+CycE/Cdk2-a in panel F). (E) Measured and simulated relative phosphorylated (Thr160) Cdk2 abundance (CycECdk2+CycECdk2-a in panel F). (F) Wiring scheme of the best approximating p21-dependent G1-S transition model. (G) Steady state analysis of active Cdk2 (CycE/Cdk2-a in F of the parameterized combined DNA damage-G1-S arrest model (Figure S4) as a function of DNA damage response (DDR), i.e. γH2AX foci, including free parameter perturbations by sampling 50 times from a uniform distribution within an interval of plus/minus 20% around the original parameter value. Solid line: Stable steady state of CycE/Cdk2-a of the parameterized model as a function of DNA damage (DDR). Light gray region: 5-95% of stable steady states of CycE/Cdk2-a of the parameterized model with perturbed free parameters. Dark gray region: First to third quartile of steady states of CycE/Cdk2-a of the parameterized model with perturbed free parameters. Inset: Steady state γH2AX foci, i.e. BASE+TAF from Figure S4, as a function of IR [Gy]. A-D: Lines indicate simulations of the fitted model. Symbols indicate mean measured values ± SEM (n≥3) scaled to day 0. Representative Western Blots are shown in Figure S6, Supplemental Figures. The corresponding data are provided in Supplemental Data Sets 1-13.