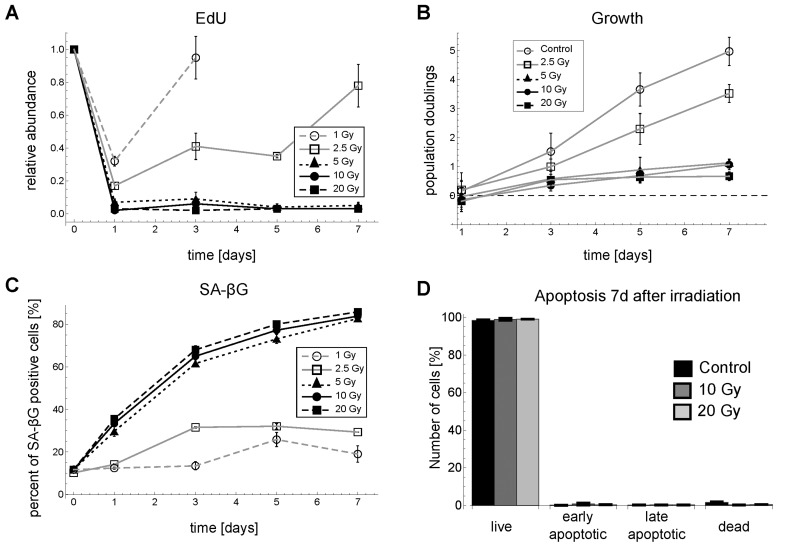
Figure 1.Time series for G1-S arrest and senescence for different γ-irradiation regimes in MRC5 fibroblasts. (A) Relative abundance of EdU positive cells (mean ± SEM (n≥3)). (B) Population doublings (mean ± SEM for at least three independent cell counts with >100 cells each) (C) SA-βG activity (mean ± SEM (n=3)). (D) Percentage of live cells (negative for both Annexin V and propidium iodide (PI), early apoptotic cells (positive for Annexin V and negative for PI), late apoptotic/necrotic cells (positive for both Annexin V and PI) and dead cells (negative for Annexin V and positive for PI (mean ± SE (n=3)). Representative FACS scatter plots for EdU and SA-βG measurements are shown in Figure S5.
Figure 1 — To senesce or not to senesce: how primary human fibroblasts decide their cell fate after DNA damage | Aging