Submit an Article
Navigate
Home
Editorial Board
Editorial Policies
Current Volume
Archive
Scientific Integrity
Publication Ethics Statements
Interviews with Outstanding Authors
Newsroom
Sponsored Conferences
Podcast
Contact
Special Collections
Submit an Article
Online ISSN: 1945-4589
Research Paper
|
Volume 8, Issue 1
|
pp. 111–124
Metabolic effects of a 13-weeks lifestyle intervention in older adults: The Growing Old Together Study
Back to article
Figure 4
(4 of 5)
−
100%
+
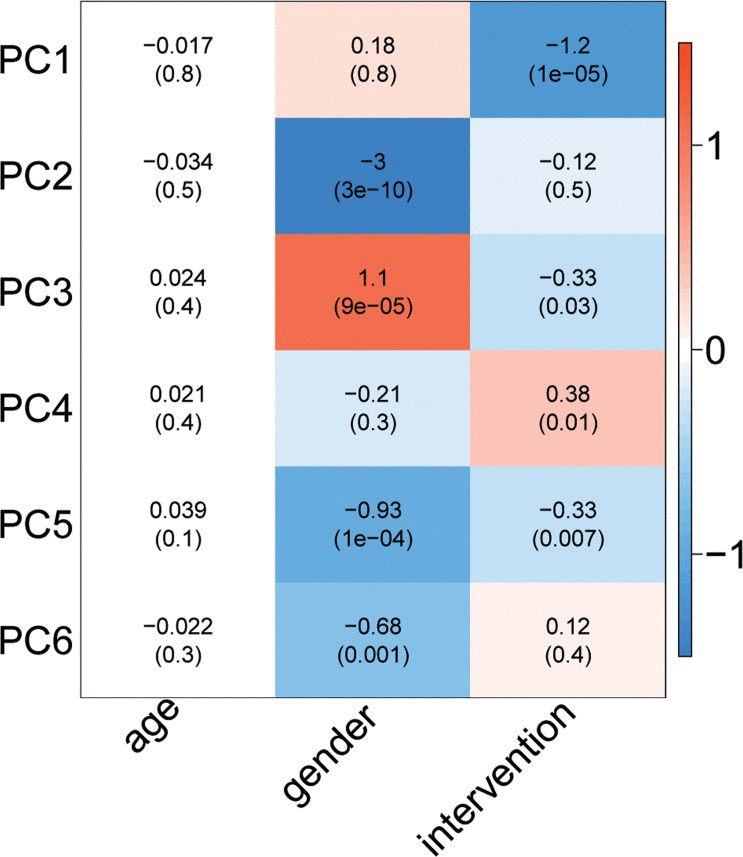
Figure 4.
Effect of age, gender, and intervention on
1
H-NMR metabolite-based PC's. The colour of the blocks represents the magnitude of the effect, while the P-value is mentioned between brackets.