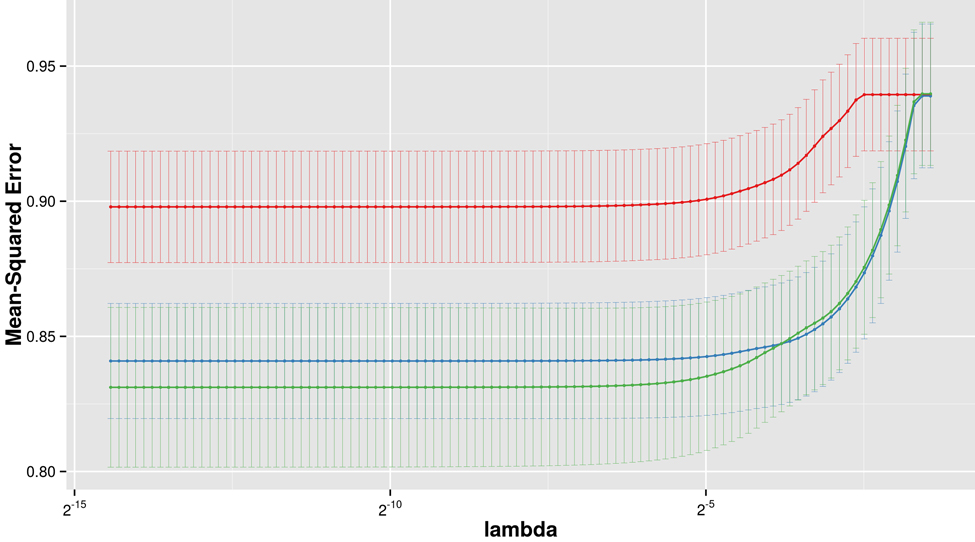
Figure 2.LTL prediction performanceThe figure shows the prediction performance (mean square error on Y axis) of three different Lasso models, based on metabolites only (red), clinical variables only (blue) and metabolites with clinical variables combined (green), dependent on the amount of regularization (lambda on x axis).