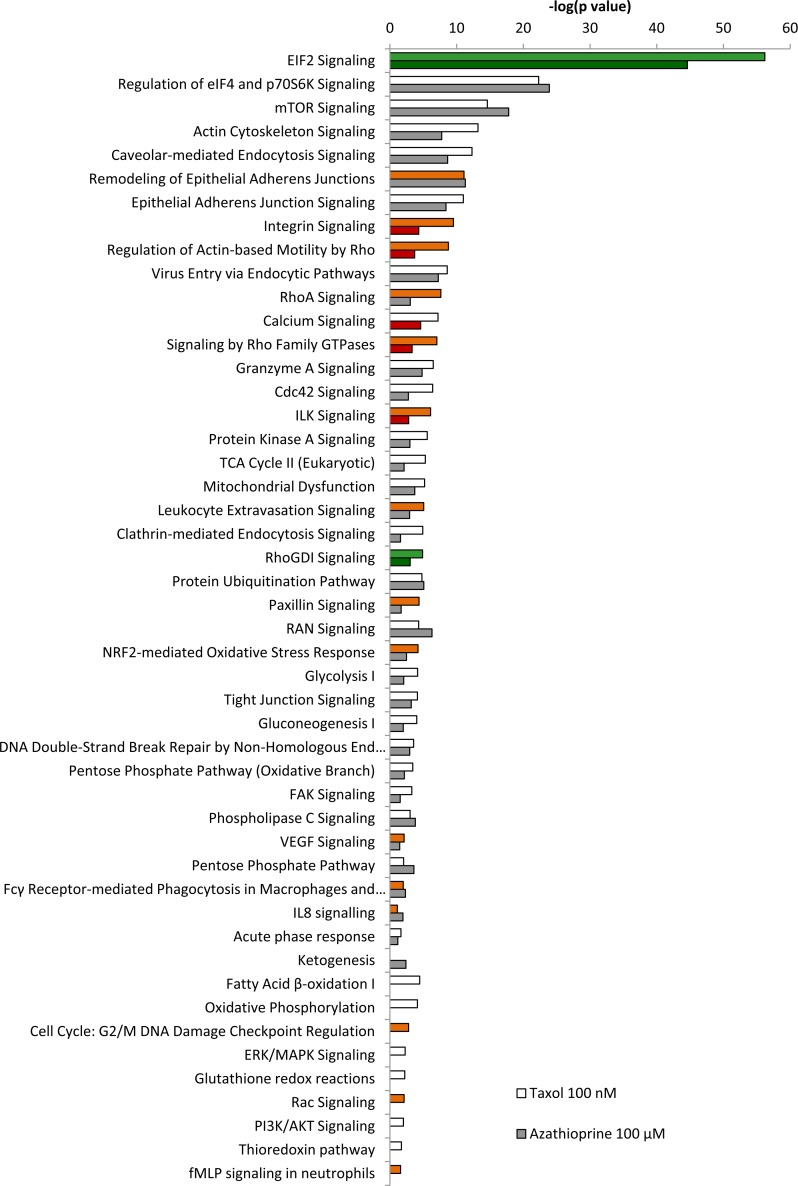
Figure 5.Pathway analysis of differentially expressed proteins in hTERT-BJ1 fibroblasts treated with azathioprine or taxol compared to vehicle-treated cellsIngenuity Pathway Analysis showed canonical pathways significantly altered by the proteins differentially expressed in hTERT-BJ1 fibroblasts treated with azathioprine or taxol (P < 0.05). The p value for each pathway is indicated by the bar and is expressed as −1 times the log of the p value. Green coloured bars show a predicted inhibition of the pathway (z score <-1.9) and red coloured bars indicate a predicted activation of the pathway (z score > 1.9).