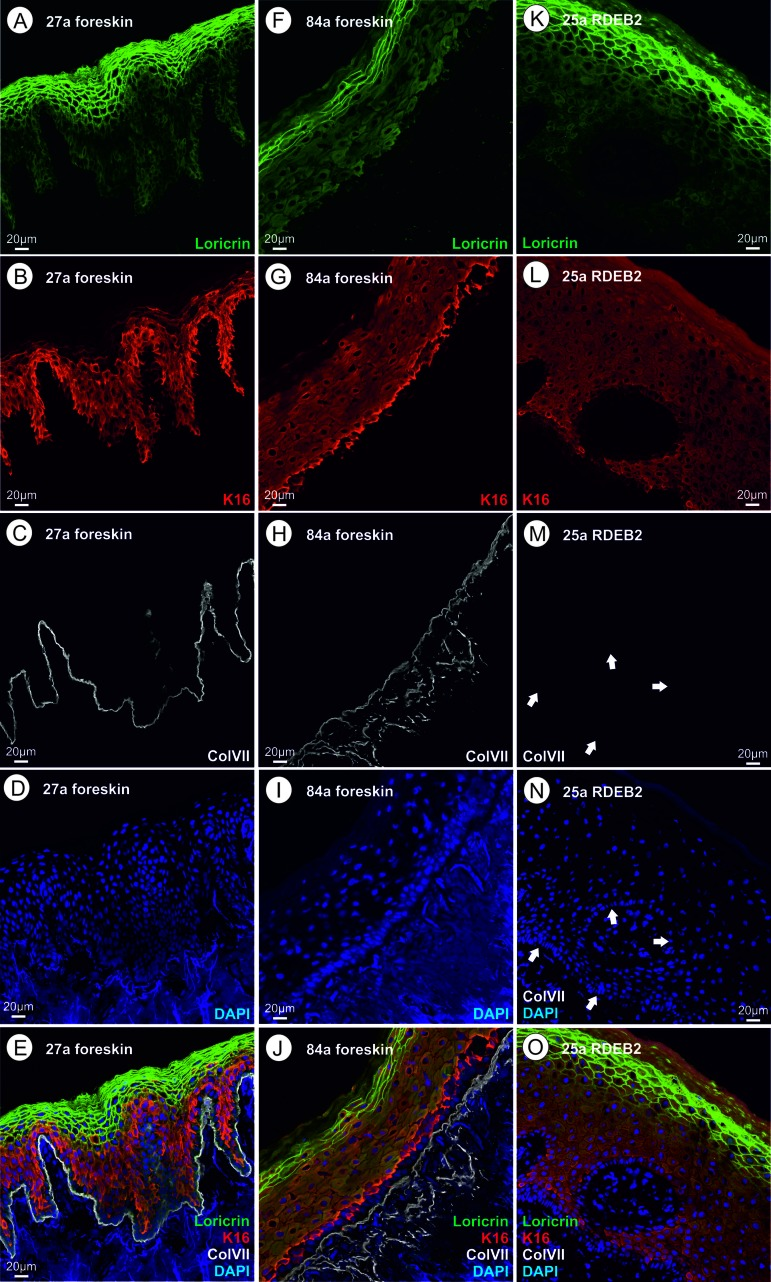
Figure 2.(A‐E) skin thin section of a healthy 27 year old proband; A loricrin immune fluorescence; B keratin XVI immune fluoresecence; C collagen VII immune fluorescence using a mouse monoclonal antibody directed to a C-terminal epitope of collagen VII; d DAPI; E overlay of A – D. (F–J) skin thin section of a healthy 84 year old proband; immunofluorescent stains as in A through D; J overlay of F – I. (K–O) skin thin section of a 25 year old RDEB patient; ; immunofluorescent stains as in A through D, arrows point to the basal lamina where the collagen VII stain would be expected; O overlay of K – N. Please see text for an interpretation of this figure.