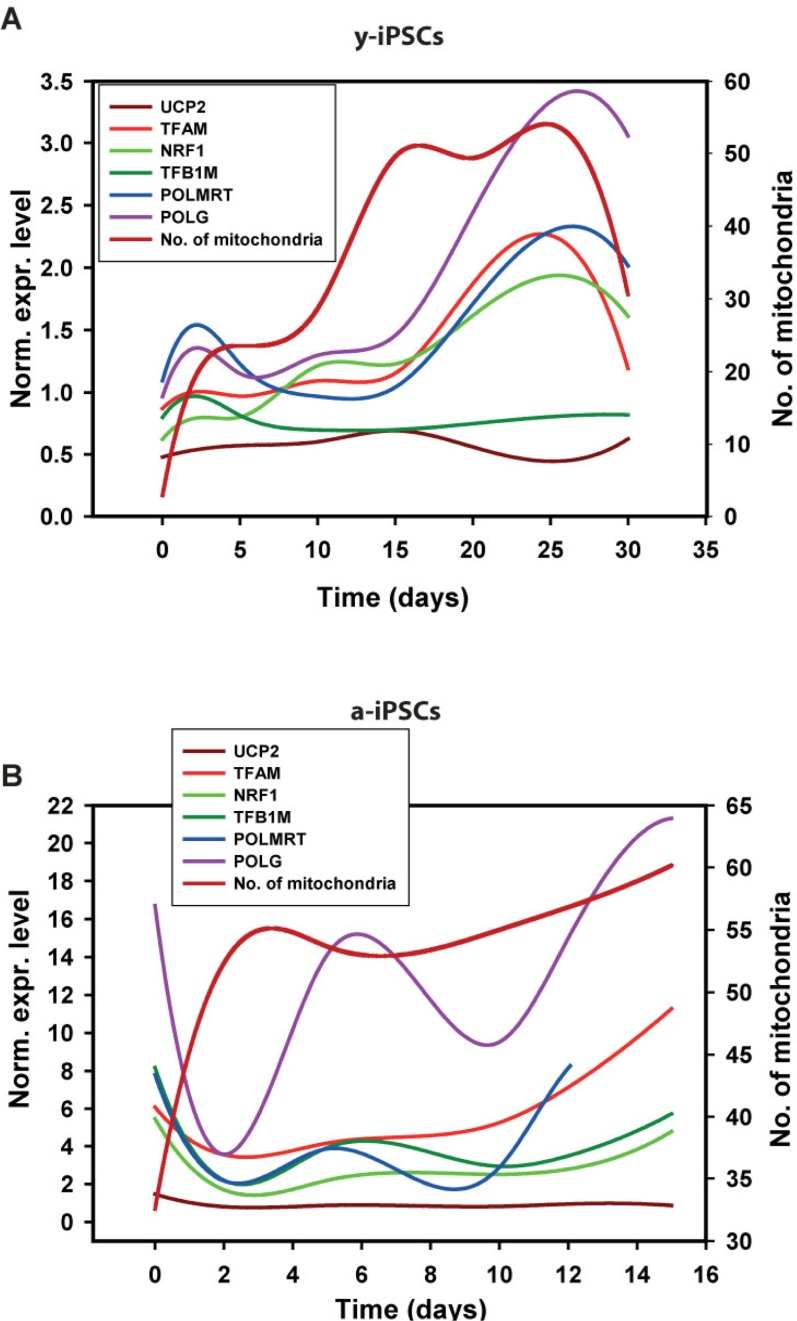
Figure 6.Gene expression analysis of genes relevant to mitochondrial biogenesis in young and aged-iPSCs during neuronal differentiation in relation to the mitochondrial numberNormalized expression levels of mitochondrial genes superimposed to the curve obtained after interpolation of mitochondrial number during differentiation of y-iPSCs (A) and a-iPSCs (B).