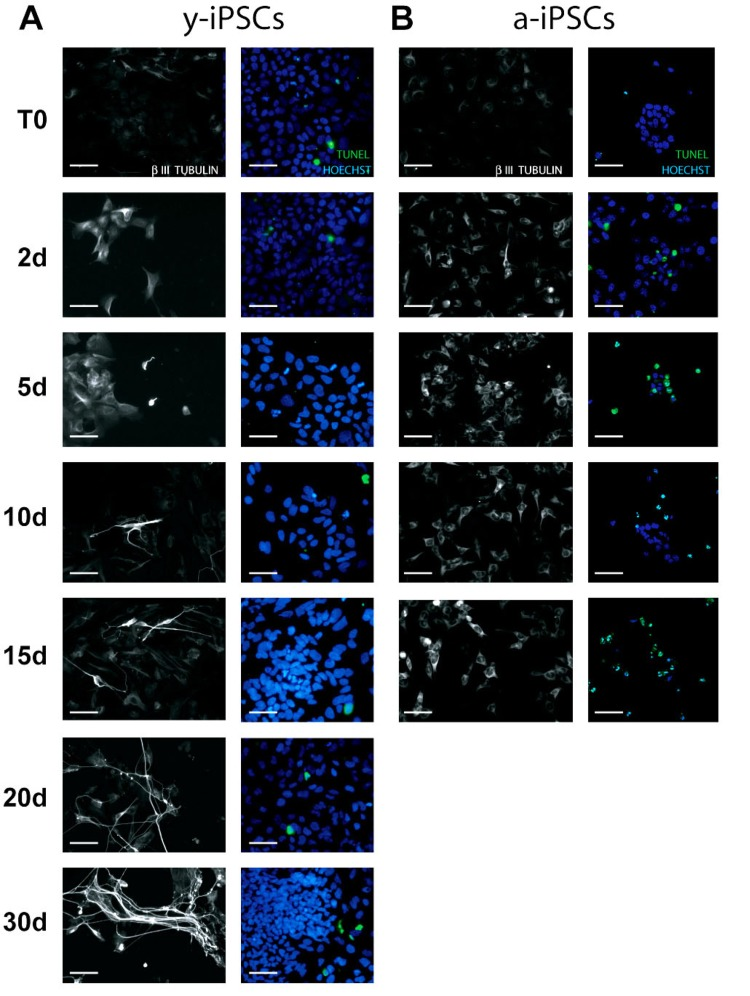
Figure 2.Analysis of neuronal differentiation and cell death in y- and a-iPSCsImmunofluorescence analysis of y-iPSCs (A) and a-iPSCs (B) during neuronal differentiation stained with the neuronal marker β–III TUBULIN with nuclei counterstained with Hoechst. On the right of each photographs, the TUNEL assay corresponding to the same experiment is reported. The green cells represent TUNEL positive cells. Scale bar: 30 μm.