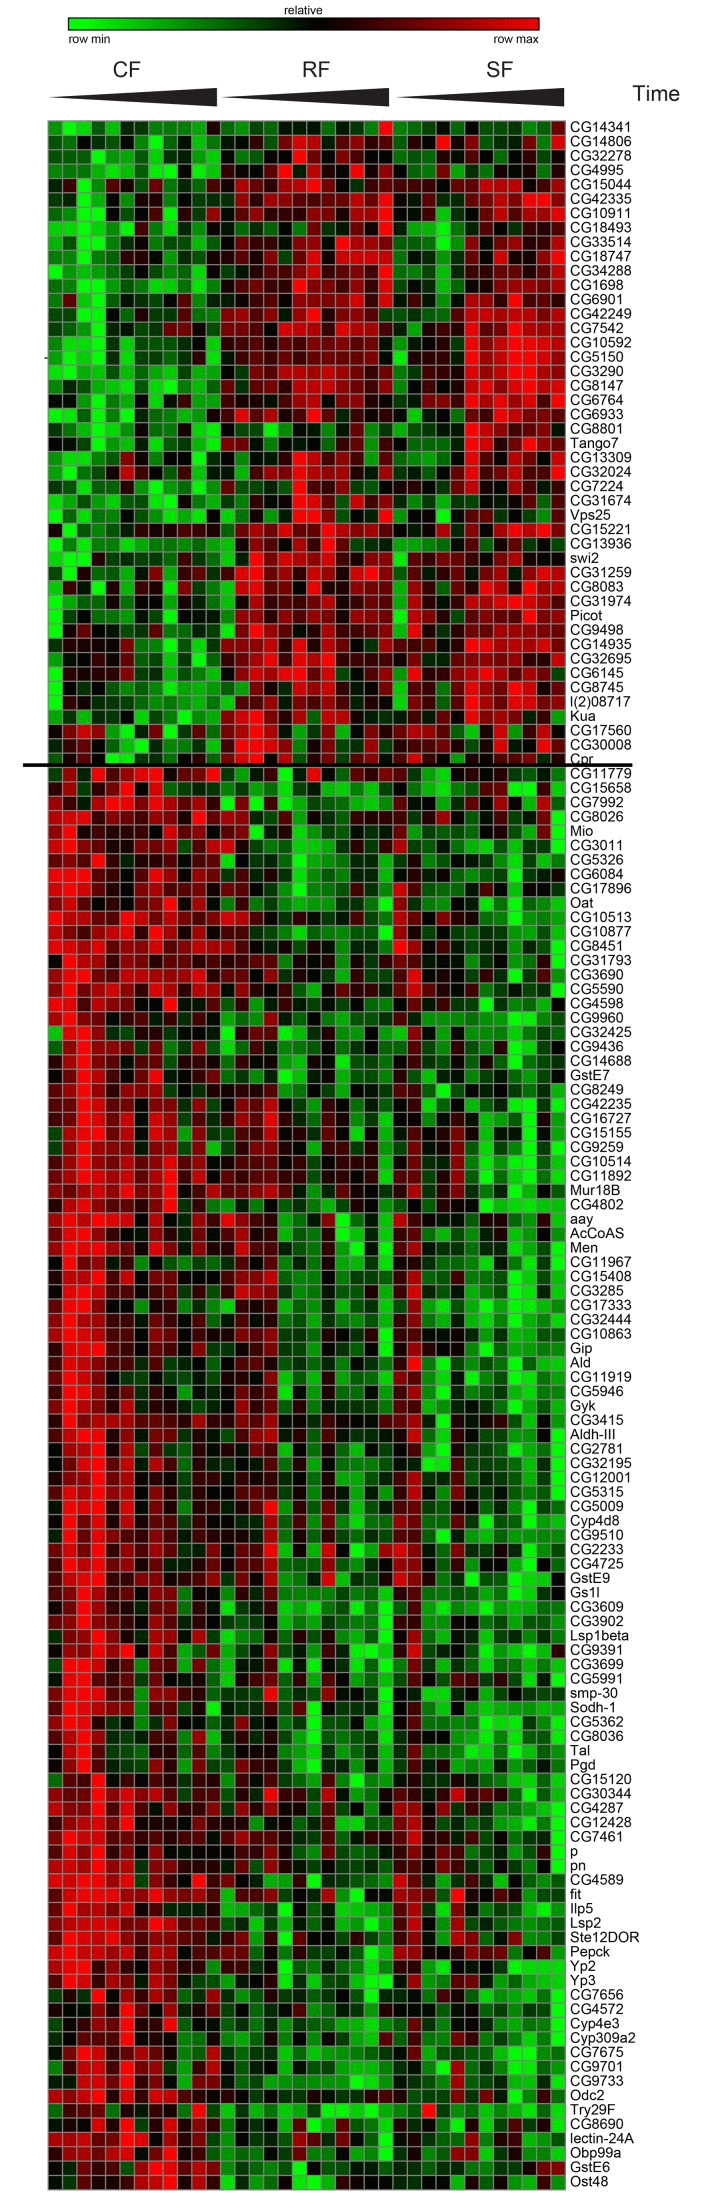
Figure 3.Gene expression of switching genesHierarchical clustering for Category I genes. The two resulting clusters are shown in a heat map of log2 expression values with green corresponding to low expressed genes and red to high expressed genes
Figure 3 — Dietary switch reveals fast coordinated gene expression changes in Drosophila melanogaster | Aging