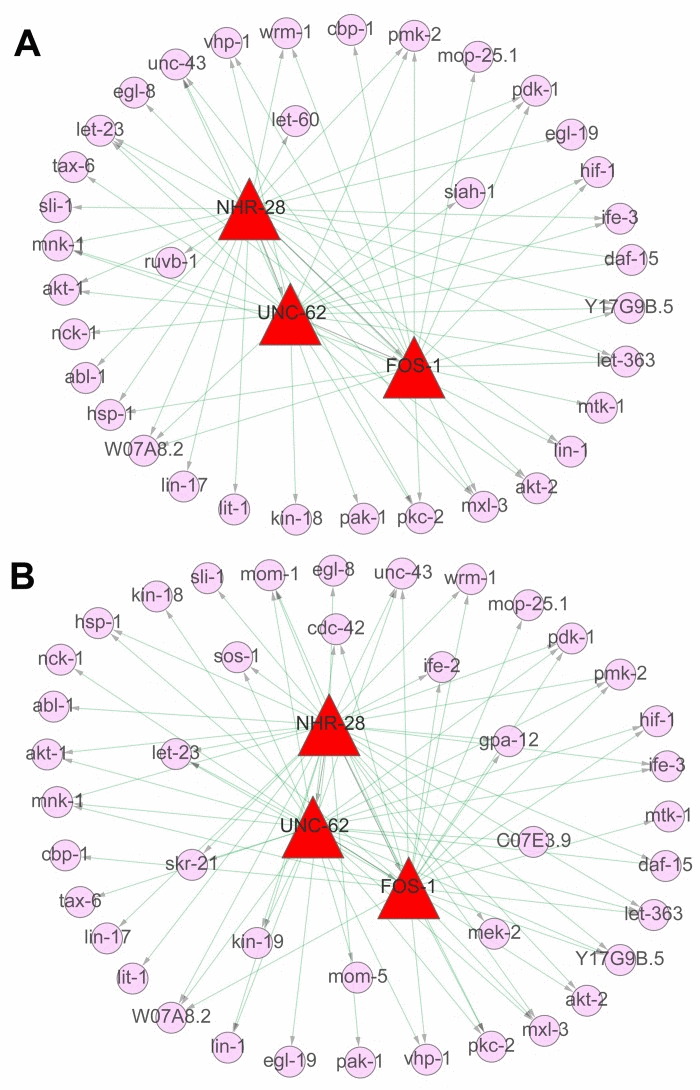
Figure 8.The regulatory networks in signaling pathways during agingThe regulatory networks were constructed based on three of aging related ChIP–seq datasets (3 TFs of NHR-28, UNC-62 and FOS-1 related) and the expression matrices of 154 involved genes in identified signaling pathways above. (A) It indicated the gene regulatory networks from the stage of L4 to D6, including the TFs (NHR-28, UNC-62 and FOS-1 in red triangular frame) as well as the target genes (in pink circle). (B) It indicated the gene regulatory networks from the stage of D6 to D15, including the TFs (NHR-28, UNC-62 and FOS-1 in red triangular frame) as well as the target genes (in pink circle). The external part represents the common genes between these two periods and the inner part represents the novel targets not appearing in the other period.