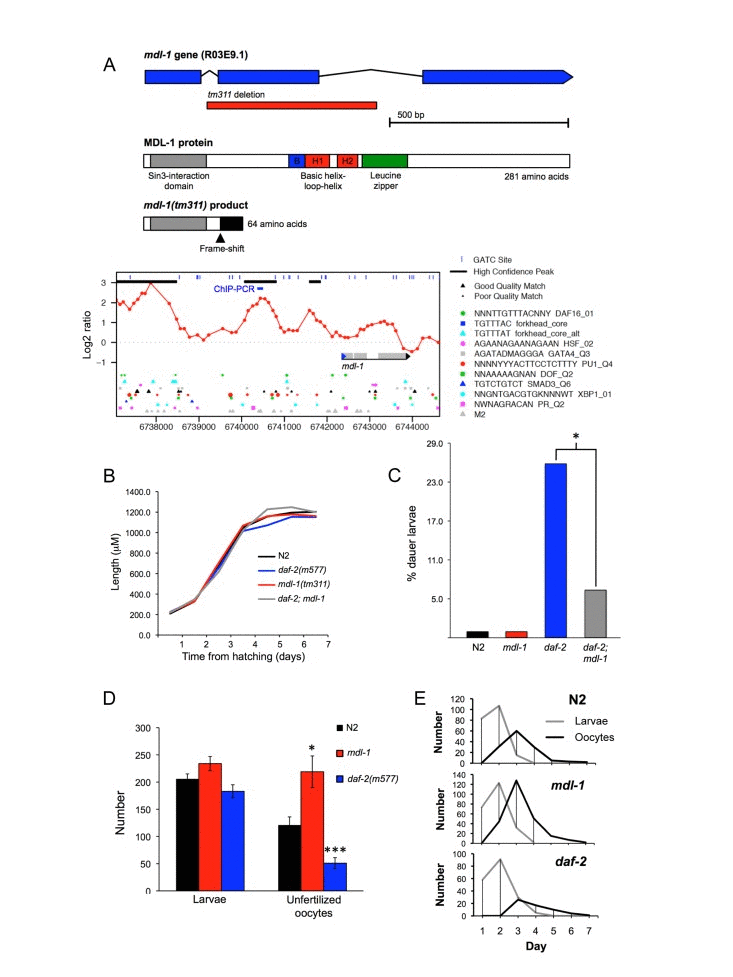
Figure 1.Phenotypic analysis of mdl-1(tm311) mutant(A) mdl-1 gene and protein description, including tm311 deletion and effects on protein, DAF-16 binding sites (chromatin profile [DamID] data and DBEs) and site of ChIP analysis. For chromatin profile, y axis represents log2 ratio of DAF-16 binding relative to control, and peaks correspond to potential DAF-16 binding sites [9]. (B-F). Phenotypic effects of mdl-1(0). (B) Little effect on larval and adult growth. Samples sizes ranged from 23-39. (C) mdl-1(0) slightly reduces daf-2(m577) Daf-c, measured at 22.9°C. * 0.01 < p < 0.05 (Student's t test). 4 trials conducted, in which mdl-1(0) reduced dauer formation in 3. (D, E) Effect of mdl-1 and daf-2 on fertility. Number of broods scored: N2, 19; daf-2, 20; mdl-1, 17. (D) Mean total progeny and unfertilized oocytes. * 0.01 < p < 0.05, *** p < 0.001 (Student's t test). (E) Mean daily progeny and unfertilized oocyte numbers.